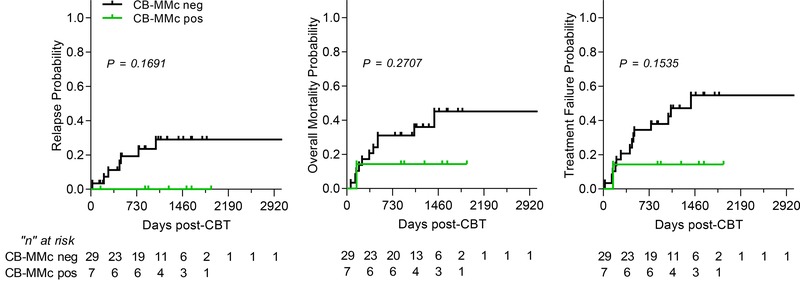
Figure 3. Probability (cumulative incidence) of relapse, overall mortality, and treatment failure post-cord blood transplantation (CBT), with a follow-up of up to 8+ years (2920+ days).
Treatment failure represents an event of relapse or death, whichever comes first (inverse of disease-free survival). P-values are from the log-rank (Mantel-Cox) test. Black lines represent patients who had no CB-MMc detectable post-CBT and green lines are patients with detectable CB-MMc post-CBT. Ticks represent censored individuals and a table below represents the number of individuals at risk.

