
Figure 4. Nav1.7I228M mutant mice do not show thermal or mechanical hypersensitivity.
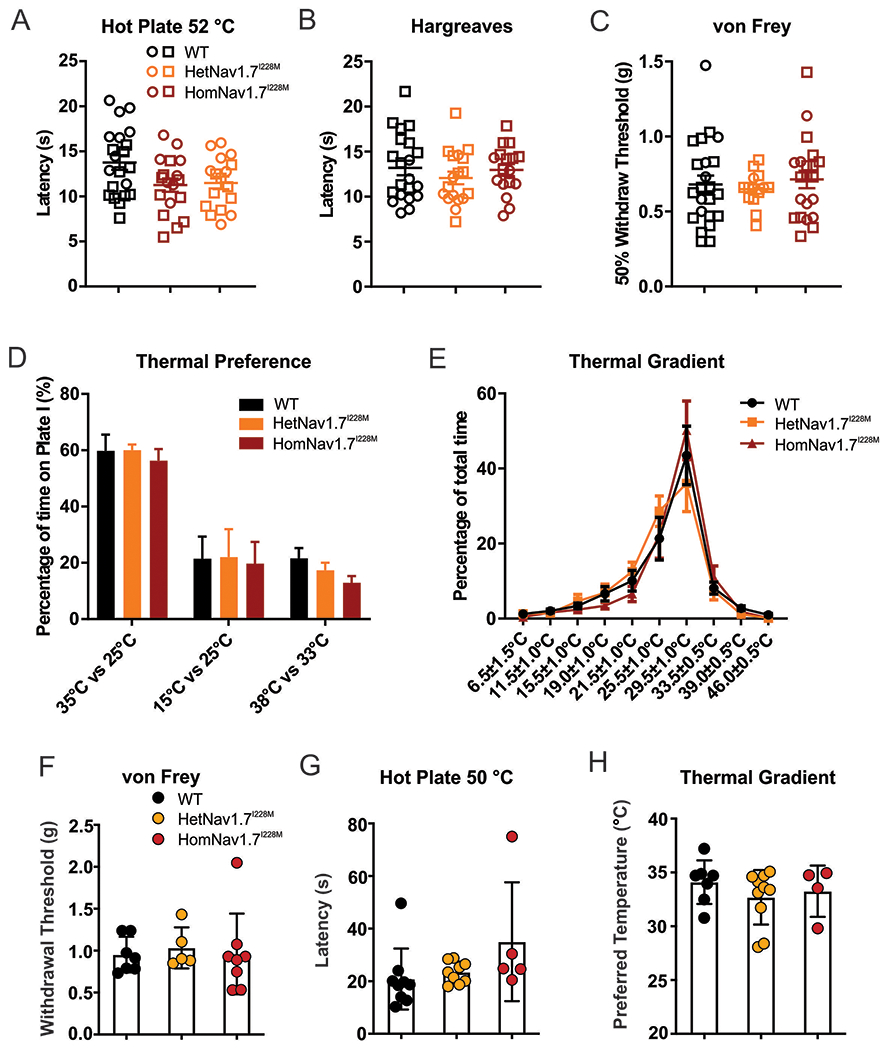
(A) Hot plate test at 52 °C. There is a trend toward lower thermal threshold in Nav1.7I228M mutant mice (HetNav1.7I228M, n=18; HomNav1.7I228M, n=17), but the difference compared to WT control littermates (n=21) does not reach statistical significance. Open circle and square represent female and male mice respectively. (B) Thermal threshold measured by Hargreaves test. No significant difference between WT (n=21), HetNav1.7I228M (n=18) and HomNav1.7I228M (n=17) groups. (C) Mechanical threshold measured by von Frey test. No significant difference between WT (n=23), HetNav1.7I228M (n=14) and HomNav1.7I228M (n=21) groups. (D) Thermal place preference test: the percentage of time spent at a test temperature versus control temperature (35 ºC vs 25 ºC, 15 ºC vs 25 ºC, and 38 ºC vs 33 ºC). The difference between groups does not reach significance (WT, n=8; HetNav1.7I228M, n=8; HomNav1.7I228M, n=8). (E) Thermal gradient test: the percentage of time spent at a range of temperature zones (6.5 ºC to 46 ºC). No significant difference is seen between WT (n=8), HetNav1.7I228M (n=8) and HomNav1.7I228M (n=8) groups. (F) von Frey test for mechanical sensitivity (Nav1.7I228M mutant mice by CRISPR gene editing). No significant difference is seen in withdrawal thresholds between WT (n=7), HetNav1.7I228M (n=5), and HomNav1.7I228M (n=8). (G) Hot plate test for thermal sensitivity at 50 °C (Nav1.7I228M mutant mice by CRISPR gene editing). No significant difference is seen between WT (n=9), HetNav1.7I228M (n=9), and HomNav1.7I228M (n=5). (H) Thermal gradient test for thermal sensitivity (Nav1.7I228M mutant mice by CRISPR gene editing). Freely moving animals placed on a gradient from 4 °C to 50 °C did not show a difference in preferred temperature between WT (n=7), HetNav1.7I228M (n=10), and HomNav1.7I228M (n=4).