FIGURE 6.
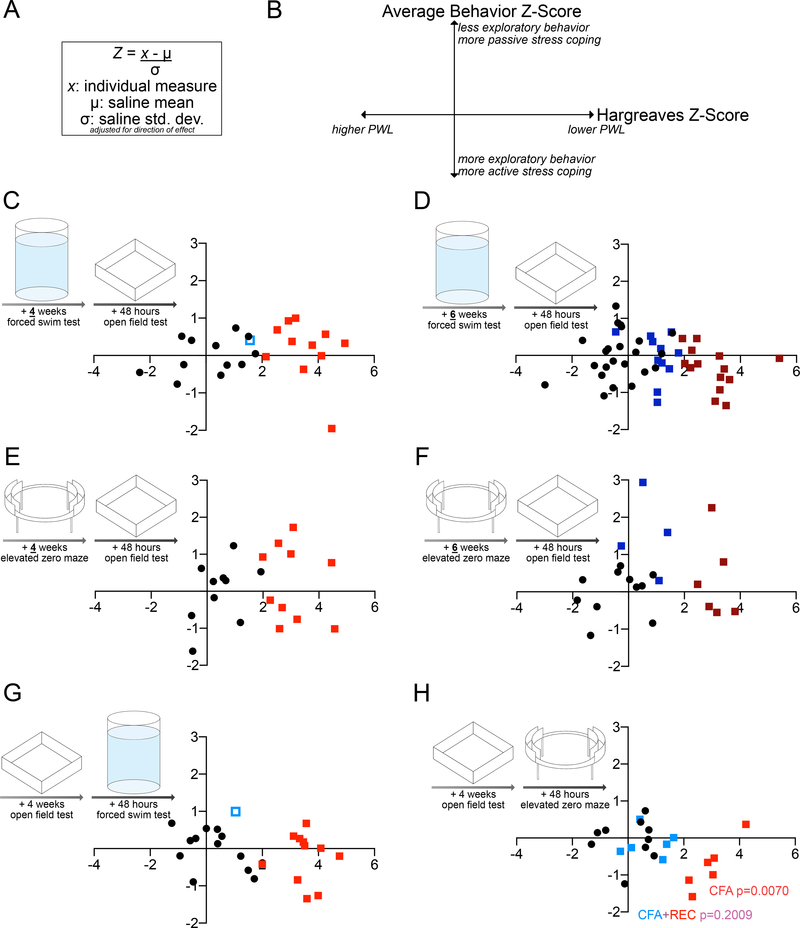
Paw withdrawal threshold in the Hargreaves assay does not correlate to average Z-score of behavior in the forced swim test, elevated zero maze, and open field test.
A: Equation used to calculate z-score for individual measurements of latency to immobility in FST, time spent immobile in FST, OR entries into open arms of EZM, time spent in open arms of EZM; AND entries into center of OFT, time in center of OFT.
B: Key for correlations. The average z-score for FST/OFT or EZM/OFT behavior lies on the Y-axis; higher values correspond to fewer entries and less time spent into the open arms OR less time immobile and longer latency to immobility, and fewer entries and less time spent in the center.
C: Individual paw withdrawal threshold in the Hargreaves assay plotted versus average Z-score of time spent immobile in the FST, latency to immobility in the FST, entries into center of the OFT, and time spent in the center of the OFT, four weeks after CFA or saline injection (n=11–12).
D: Individual paw withdrawal threshold in the Hargreaves assay plotted versus average Z-score of time spent immobile in the FST, latency to immobility in the FST, entries into center of the OFT, and time spent in the center of the OFT, six weeks after CFA or saline injection (n=11–23).
E: Individual paw withdrawal threshold in the Hargreaves assay plotted versus average Z-score of entries into the open arms of the EZM, time spent in the open arms of the EZM, and time spent in the center of the OFT, four weeks after CFA or saline injection (n=10,10).
F: Individual paw withdrawal threshold in the Hargreaves assay plotted versus average Z-score of entries into the open arms of the EZM, time spent in the open arms of the EZM, and time spent in the center of the OFT, six weeks after CFA or saline injection (n=4–11).
G: Individual paw withdrawal threshold in the Hargreaves assay plotted versus average Z-score of time spent immobile in the FST, latency to immobility in the FST, entries into center of the OFT, and time spent in the center of the OFT, four weeks after CFA or saline injection (order of behavior testing reversed from A) (n=11–12).
H: Individual paw withdrawal threshold in the Hargreaves assay plotted versus average Z-score of entries into the open arms of the EZM, time spent in the open arms of the EZM, and time spent in the center of the OFT, four weeks after CFA or saline injection (order of behavior testing reversed from C) (n=6–10).

