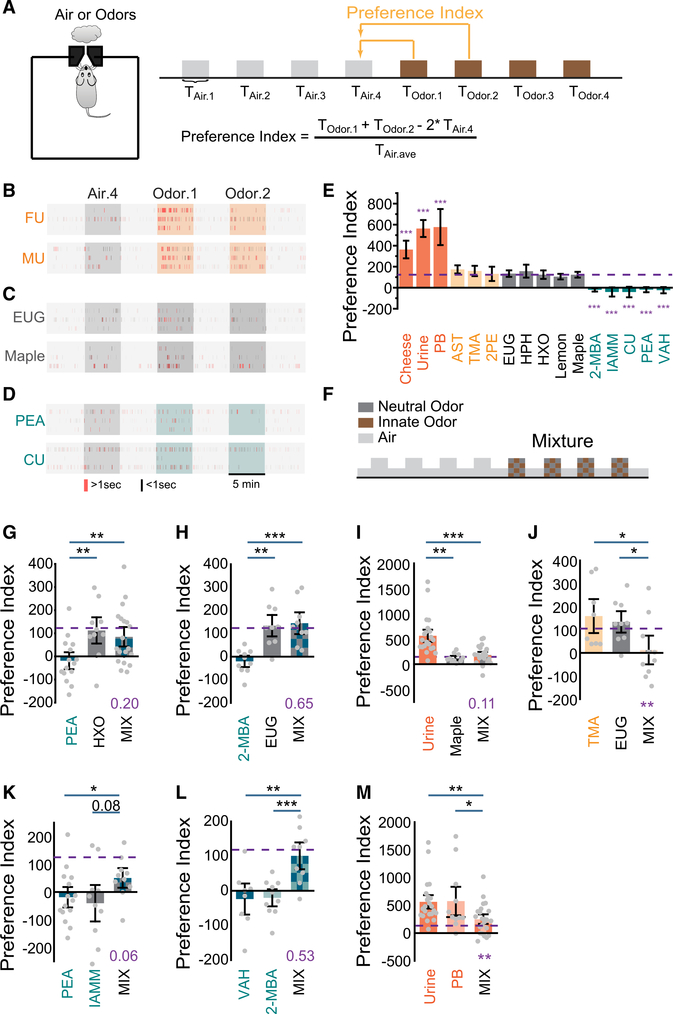
Figure 1. Odor mixtures abolish innate odor preference.
(A) Illustration of the behavior paradigm. Shown on the left is a single-odor port arena. Shown on the right is the odor presentation sequence and the quantification of preference index.
(B) Sample raster plots of odor port investigation of female (FU) and male (MU) urine presentation. Only the fourth air presentation (Air.4, gray box) and the first two odor presentations (Odor.1 and Odor.2, orange boxes) are shown. Each tick represents an investigation event. Investigations longer or shorter than 1 s are marked by red and black ticks, respectively.
(C) Same as (B) but for eugenol (EUG) and maple. Dark-gray-colored boxes indicate presentation of neutral odors.
(D) Same as (B) but for 2-phenylethylamine (PEA) and coyote urine (CU). Olive-colored boxes indicate presentation of aversive odors.
(E) Bar graph showing preference indices for a panel of odors (color coding is as follows: attractive, orange; monomolecular odors previous reported as attractive, light yellow; neutral, gray; aversive, olive). Purple dashed line indicates the averaged level for neutral odors. One-way ANOVA tests were applied to compare individual odors to the average level of neutral odors.
(F) Illustration of odor mixture experiment setup.
(G–J) Bar plots of preference indices measured for individual odor pairs and their mixtures. Urine samples were tested on the opposite sex and grouped together.
(K–M) Bar plots of preference indices measured for individual odor pairs of the same innate valence and their mixtures.
Purple dashed line indicates the average level for neutral odors. One-way ANOVA with Tukey test was applied to determine whether the mixture is attractive or aversive (p value in purple). All bar graph data are shown in mean ± SEM. *p < 0.05, **p < 0.01, ***p < 0.001, probability is shown when p > 0.05.

