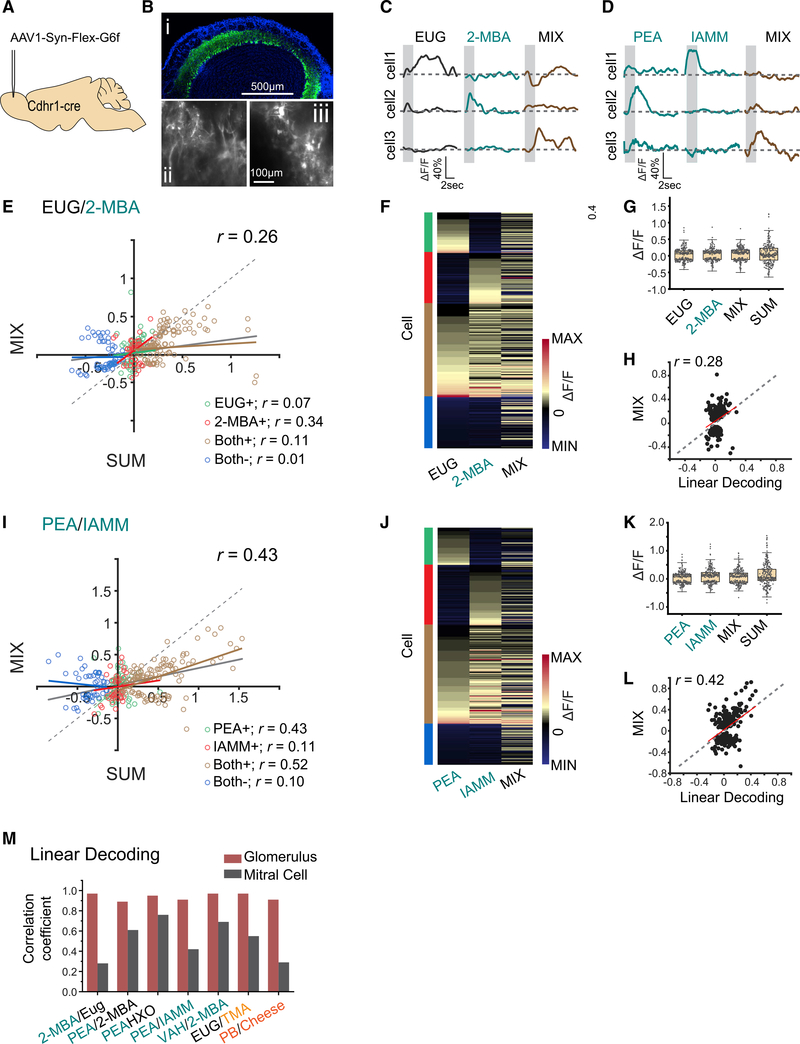
Figure 3. Cross talk among odor channels in the mitral and tufted cell population.
(A) Illustration of AAV-mediated GCaMP6f expression in M/T cells.
(B) GCaMP6f expression in olfactory bulb 3 weeks after virus injection (i). Color coding is as follows: green, GCaMP6; blue, DAPI. Two-photon images showing the GCaMP6f expression in the glomerulus layer (ii) and in cell bodies (iii). Scale bars are indicated.
(C and D) Sample traces of M/T cell response to EUG, 2-MBA, and their mixture (C) or to PEA, IAMM, and their mixture (D). Gray box indicates odor delivery period.
(E) M/T cell response evoked by the mixture plotted against the sum of response to individual odors. They are color coded to indicate positive response (increased calcium signal) to EUG only (EUG+), 2-MBA only (2-MBA+), or both odors (Both+); and negative response (decrease in calcium signal) to both odors (Both−). Gray line indicates the linear fit for all data points. Colored lines indicate linear fit of each group of data. Pearson’s correlation coefficients (r) and diagonal line (gray dash) are indicated.
(F) Heatmap of M/T cell responses to EUG, 2-MBA, and their mixture. Cells are sorted according to their response to EUG only, 2-MBA only, positive response to both odors, and negative response to both odors. Groups are indicated with the same color scheme as in (E).
(G) Boxplot of the distribution of M/T cell response to EUG, 2-MBA, their mixture, and the arithmetic sum of component odors. Boxplot edges indicate the first and third quartiles of the data; whiskers indicate 1.5 interquartile range.
(H) Response of individual M/T cells to the mixture plotted against the predicted response from linear decoding for odor pair EUG/2-MBA. Red line indicates linear-fit of the linear decoding data from the responses of EUG and 2-MBA with activity from mixture. Pearson’s correlation coefficient (r) and diagonal line (gray dash) are indicated.
(I–L) same as (E)–(H) but for two aversive odor pair PEA and IAMM.
(M) Bar graphs shows the correlations coefficients (r) between linearly decoded and the actual responses of the glomeruli (burgundy color) and M/T cells (dark gray) for seven odor pairs.
See also Figures S4 and S5 and Table S1.

