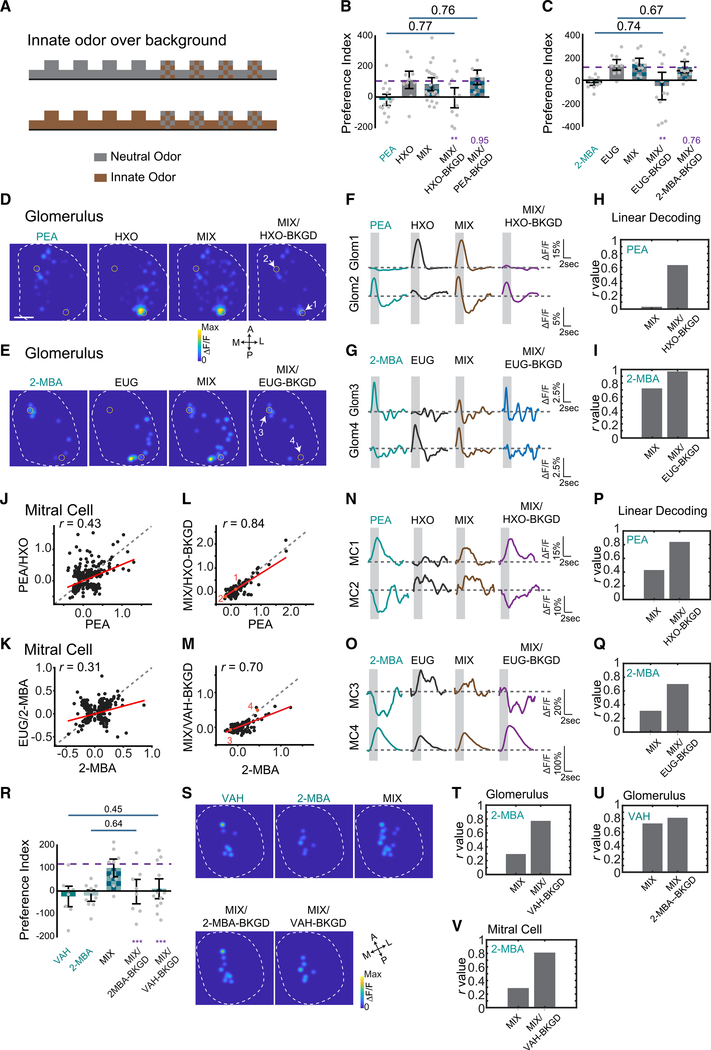
Figure 5. Background presentation of odors allows segmentation.
(A) Illustration of experimental paradigm. One of the odors (neutral or aversive) is delivered continuously as background. The mixture is delivered during the marked epochs.
(B and C) Bar plots of preference indices measured for individual odors and their mixtures, and the mixture when one of the component odors was presented as background for PEA and HXO (B), and for 2-MBA and EUG (C). Purple dashed line indicates the average level for neutral odors. One-way ANOVA with Tukey test was applied. Statistical significance or the p values are marked by purple labels.
(D and E) Glomerulus activation patterns elicited by PEA and HXO (D) or 2-MBA and EUG (E) mixture after exposed to HXO (D) or EUG (E) as background.
(F and G) Traces of glomerular (Glom) (indicated in D and E) responses to individual odors and the mixture in the absence and presence of background presentation for odor pairs PEA and HXO (F) and 2-MBA and EUG (G).
(H and I) Bar graphs show the Pearson’s correlation coefficients (r) between linearly decoded mixture response and the actual glomerular responses to PEA (H) or 2-MBA (I) with or without background presentation.
(J and K) Scatterplots of M/T cell responses to PEA and HXO mixture against that to PEA (J), and 2-MBA and EUG against 2-MBA (K) without background presentation. Red line indicates linear fit of the data. Pearson’s correlation coefficient (r) and diagonal line (gray dash) are indicated.
(L and M) Same as in (J) and (K) but with neutral odor presented as background.
(N and O) Traces of M/T cells (MCs) (indicated in L and M) responded to individual odors and the mixture with or without background presentation for odor pairs PEA and HXO (N) and 2-MBA and EUG (O), respectively.
(P and Q) Bar graphs show the Pearson’s correlations coefficient (r) between linearly decoded mixture response and the actual M/T cell responses to PEA (P) or 2-MBA (Q) with or without background presentation. Correlation coefficient (r) values are plotted.
(R) Bar plot of preference indices measured for VAH, 2-MBA, and the mixture when one of the component odors is presented as background.
(S) Glomeruli activation patterns elicited by VAH, 2-MBA, and the mixture after exposure to VAH or 2-MBA as background.
(T and U) Bar graphs show the Pearson’s correlation coefficients (r) between linearly decoded mixture response and the actual glomerular responses to 2-MBA (T) or VAH (U) with or without background presentation.
(V) Bar graphs show the Pearson’s correlation coefficients (r) between linearly decoded mixture response and the actual M/T cell responses to 2-MBA with or without VAH as background presentation.
See also Figures S6 and S3, and Table S1.

