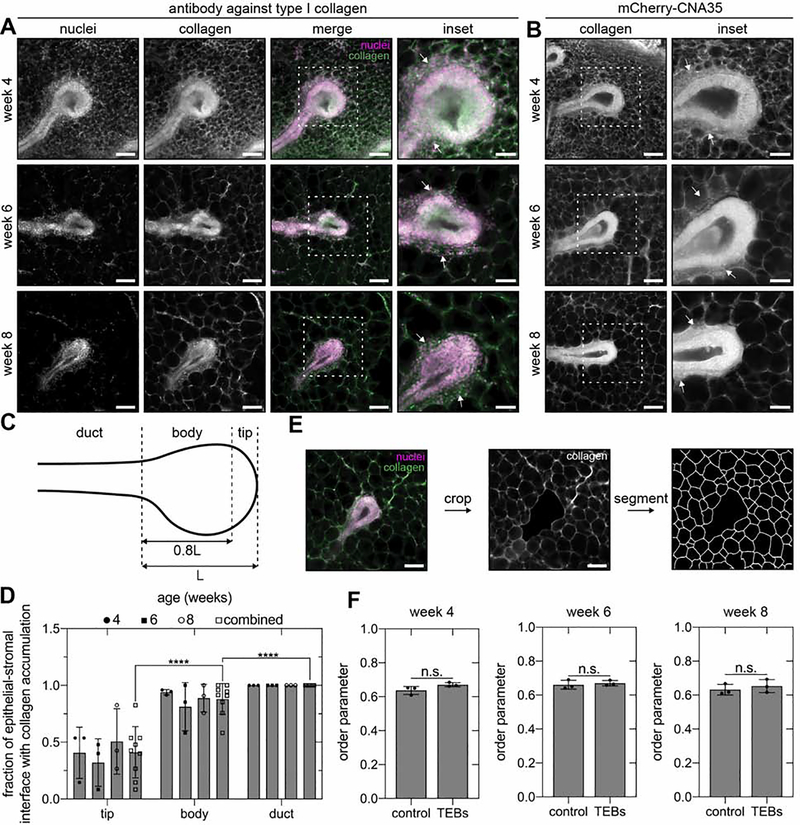
Figure 2. Type I collagen accumulates along the flanks of extending TEBs.
Representative fluorescent images of TEBs in 4-, 6-, and 8-week-old no. 4 inguinal mammary glands labeled with an A) antibody against type I collagen or B) the collagen-binding protein mCherry-CNA35. White arrows denote collagen accumulation. C) Schematic of the tip, body, and duct regions of a TEB and D) quantification of collagen accumulation in each region. E) Representative segmentation of adipocyte cell borders surrounding a TEB and F) order parameter describing the orientation of epithelial extension with respect to adipocyte packing in a randomly selected region of the fat pad (control) or around TEBs. Scale bars represent 100 μm or 50 μm for insets. Data are represented as mean ± SD. ****p ≤ 0.0001 and n.s., not significant. See also Figure S2.

