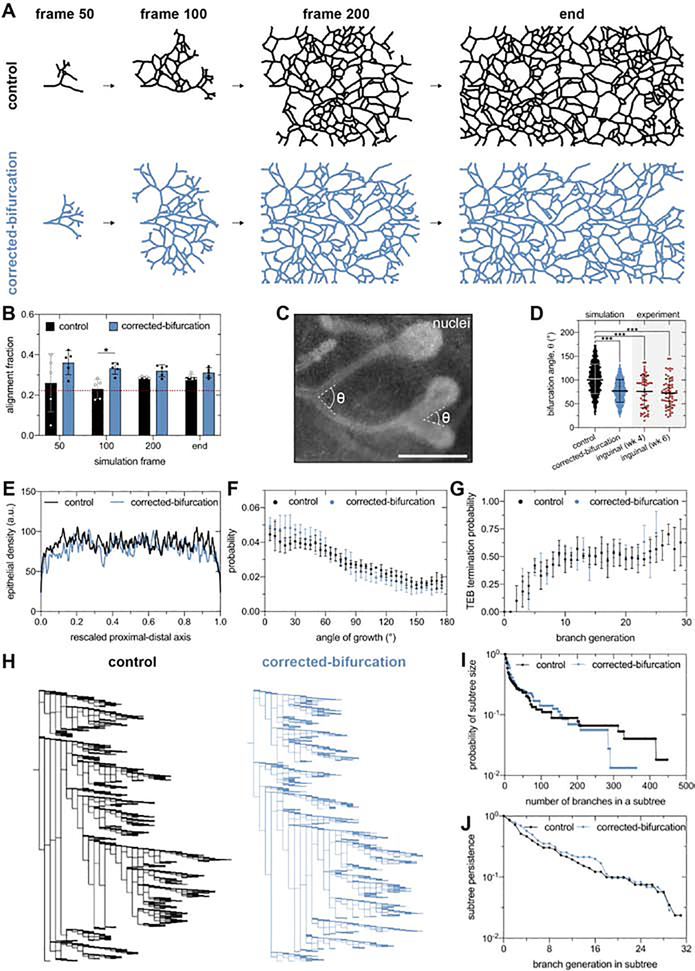
Figure 5. The angle of bifurcation of TEBs dictates the global alignment of simulated mammary epithelium.
A) Representative control and corrected-bifurcation BARW simulations and B) corresponding quantification of alignment fraction as a function of simulation time. The dashed red line represents the alignment fraction corresponding to an epithelium without an orientation bias. C) Representative bifurcation angles measured from a fluorescent image of a bifurcating mammary epithelium labeled with Hoechst 33342. Scale bar represents 500 μm. D) Distribution of bifurcation angles quantified in control and corrected-bifurcation simulations and 4- and 6-week-old inguinal mammary glands; n=54 and 65 measurements for 4- and 6-week-old glands, respectively. Quantification of E) epithelial density, F) angle of growth probability, and G) TEB annihilation probability for control and corrected-bifurcation BARW simulations. H) Representative lineage tree for control and corrected-bifurcation BARW simulations as well as quantification of I) subtree size and J) subtree persistence. Data are represented as mean ± SD in panels b, d, f, and g or as the mean in panels e, i, and j. *p ≤ 0.05 and ***p ≤ 0.001. See also Figure S5.

