
Figure 4.
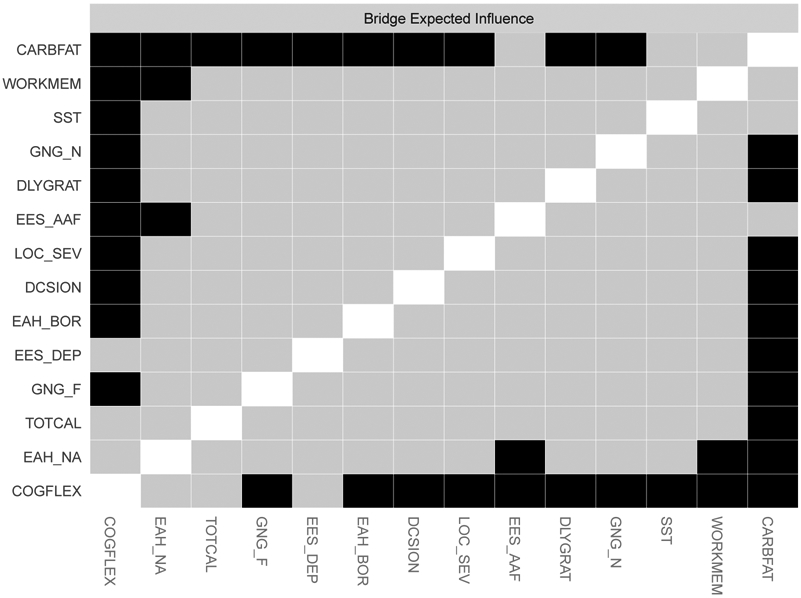
Bridge expected influence difference graph for the executive dysfunction-disinhibited eating network. Symptoms are presented in descending order of expected influence. Black squares indicate a statistically significant difference between nodes at the p < .05 level.