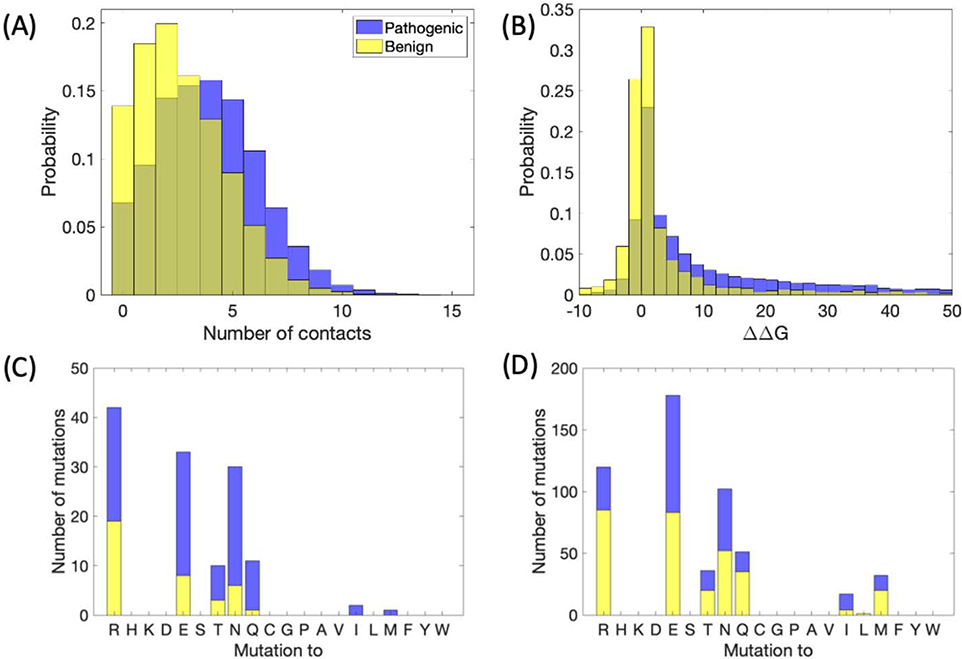
Figure 2.
Local structural information from missense SNPs. A) Histogram of number of contacts (at least six atom-atom contacts less than five angstroms), for benign and pathogenic variants, with the mutated residue within a known crystal structure. B) ΔΔG in kcal/mol, predicted by EvoEF. C-D) Stacked bar plots indicating the number of benign and pathogenic variants mutated from lysine to the specified residue for C) number of contacts greater than or equal to five, D) number of contacts less than five.

