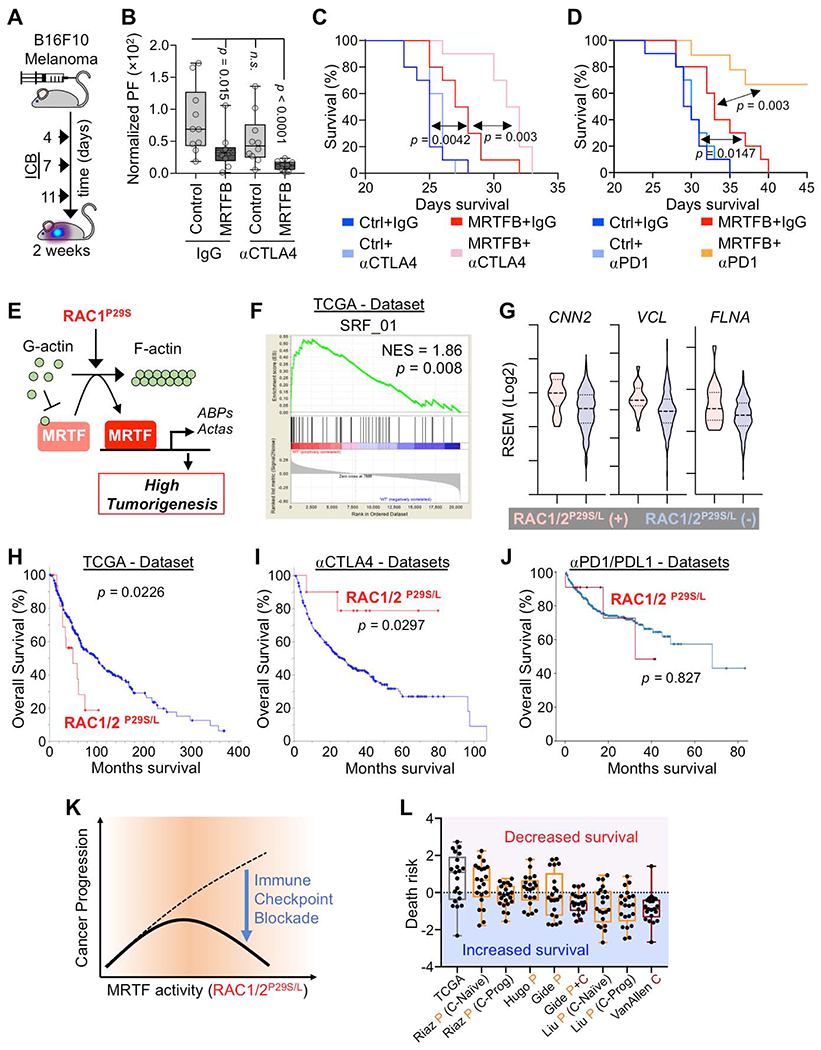
Fig. 3. MRTF boosts therapeutic T cell responses in the context of ICB.

(A) Experimental design for ICB treatment of mice inoculated with B16F10 melanoma. (B) BLI of mice 2 weeks after injection with B16F10 cells overexpressing MRTFB or control vector and treatment with control IgG or anti-CTLA4 antibody (n = 10 mice per group). Box plots show upper and lower quartiles, median, maximum, and minimum values. p values calculated by Mann-Whitney test, n.s.: not significant for p = 0.1655. (C) Kaplan-Meier survival curves for percent survival of mice in B (n = 10 mice per group). (D) Kaplan-Meier survival curves for percent survival of mice injected with B16F10 cells overexpressing MRTFB or control vector and treated with control IgG or anti-PD1 antibody (n = 10 mice per group). (E) Diagram of pathway linking oncogenic RAC1P29S to MRTF (Lionarons et al., 2019). Acta: actin family of proteins, ABPs: actin binding proteins. (F) GSEA of MRTF-SRF target gene expression enrichment in RAC1/2P29S/L mutant skin cutaneous melanoma patients in The Cancer Genome Atlas (TCGA) dataset. NES: normalized enrichment score. (G) Violin plots showing increased expression of known MRTF-SRF target genes in RAC1/2P29S/L patients. Dashed lines medians, dotted lines upper and lower quartiles. (H-J) Overall survival of RAC1/2P29S/L patients in the TCGA dataset (H) and in melanoma patients treated with anti-CTLA4 (I) or anti-PD1/PDL1 (J). Anti-CTLA4 data was derived from Samstein et al., 2019 (75 patients); Miao et al., 2018 (144 patients); Van Allen et al., 2015 (20 patients); Catalanotti et al., 2017 (21 patients), and Liang et al., 2017 (14 patients). Anti PD-1 data was derived from Cheng et al., 2015 (375 patients). p values in C-D and H-J were calculated by Log-rank test. (K) MRTF activity induced by RAC1/2P29S/L potentiates melanoma progression (similar to Fig. 1I) but simultaneously sensitizes cancer cells to ICB. (L) Association between MRTF-SRF induced genes and survival for the TCGA data set and the indicated ICB data sets (n = 21 genes). Box plots show upper and lower quartiles, median, maximum, and minimum values. Anti-PD1 trials (letter P) are shown in orange and anti-CTLA4 trials (letter C) in maroon. See also Fig. S4 and supplemental tables 1–4.
