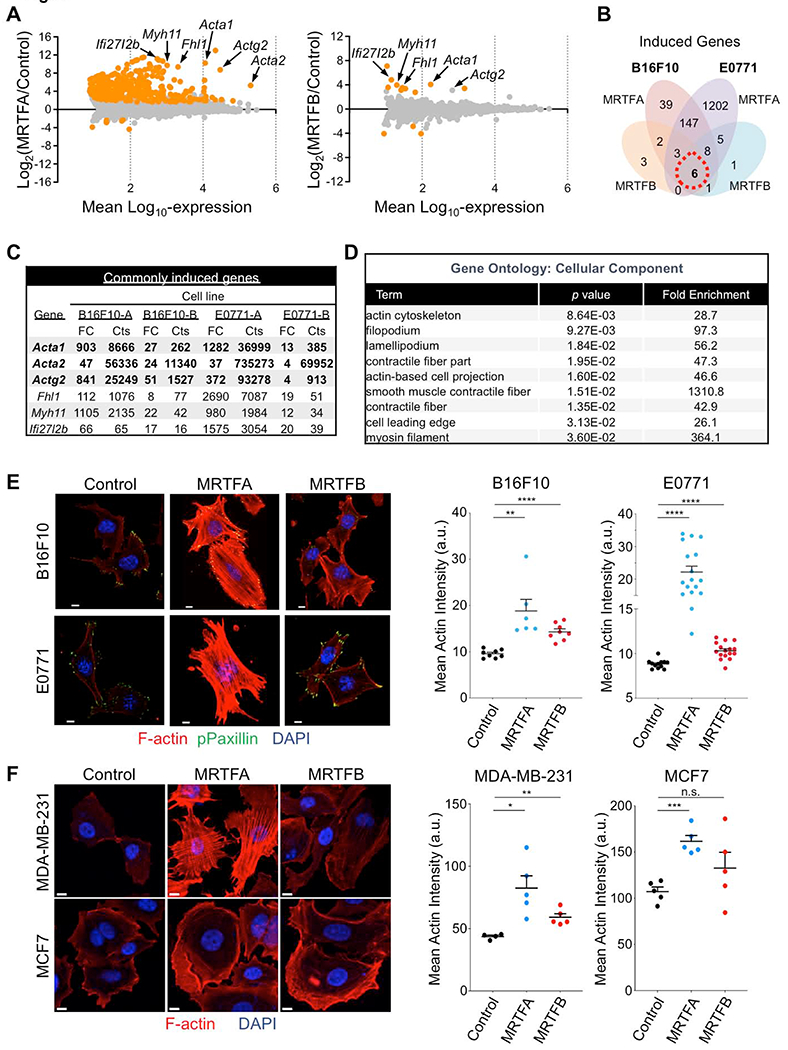
Fig. 4. MRTF overexpression augments the F-actin cytoskeleton.

(A) Mean-difference plots showing gene expression changes induced by MRTFA (left) and MRTFB (right). Graphs incorporate data from both B16F10 and E0771 cells. Statistically significant gene expression changes are colored orange (p ≤ 0.05). Strongly induced genes encoding actin isoforms and F-actin regulators are indicated. (B) Venn diagram of induced genes exclusive to or shared by B16F10 and E0771 cells overexpressing MRTFA or MRTFB in culture. (C) Left, table of commonly induced genes, in which genes with over 50 RNA sequence counts in all data sets are shown in bold. FC: Fold Change, Cts: RNA sequencing read counts. (D) Gene Ontology (GO) analysis using the set of genes induced by MRTFA or MRTFB in all cell lines (red dashed circle in Venn diagram). Statistically significant GO terms are shown with reported p values. (E-F) Left, confocal images of representative murine (E) and human (F) cancer cells. Control and MRTFA/B overexpressing lines were stained with with DAPI (blue), phalloidin (F-actin, red) and anti-phospho-paxillin (green, E only). Right, graphs showing mean actin intensity for each cell line. Error bars denote SEM, n.s.: not significant for p > 0.05, **p ≤ 0.01, ****p ≤ 0.0001; two-tailed Student’s t test; n ≥ 8 images per cell line in E, n = 5 images per cell line in F; representative of 3 independent experiments. All scale bars: 10 μm. See also Fig. S5.
