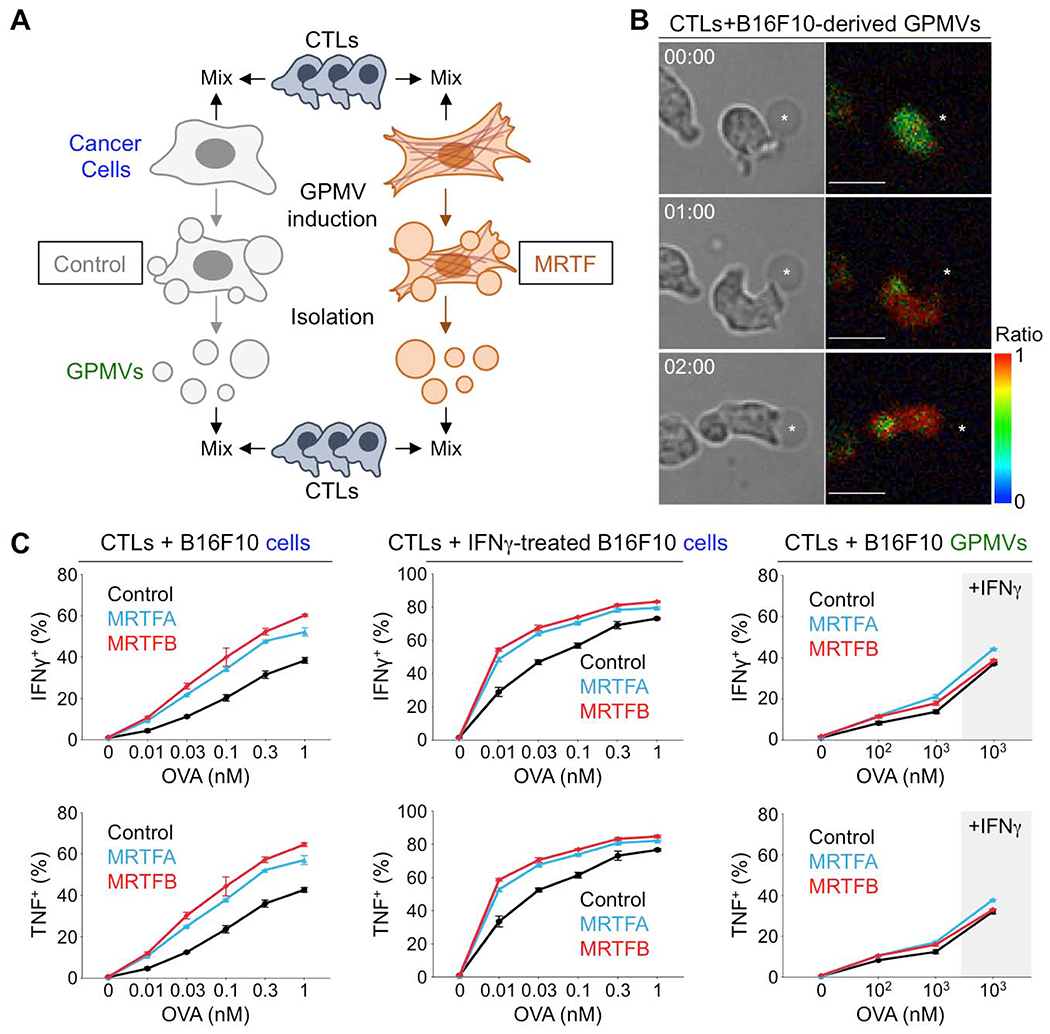
Fig. 6. Cytoskeletal stiffness underlies the immune vulnerability of metastatic cells.

(A) CTLs were stimulated using OVA-loaded B16F10 cells or GPMVs derived from these cells. (B) Time-lapse montage of a representative OT1 CTL Ca2+ response during contact with an OVA-loaded B16F10-derived GPMV (asterisk). Paired bright field (left) and pseudocolored Fura-2 ratio images (right) are shown. Time in MM:SS is indicated in the upper left corner of each bright field image. Scale bars: 10 μm. Color bar indicates the value of the Fura-2 ratio. (C) Graphs showing the percentage of CTLs producing IFNγ or TNF, measured by intracellular staining 4 h after mixing with B16F10 cells (left), B16F10 cells pretreated with IFNγ (center), or GPMVs derived from untreated or IFNγ-treated B16F10 cells (right). Data shown as mean ± SEM of technical triplicates, representative of 3 independent experiments. See also Fig. S6 and S7.
