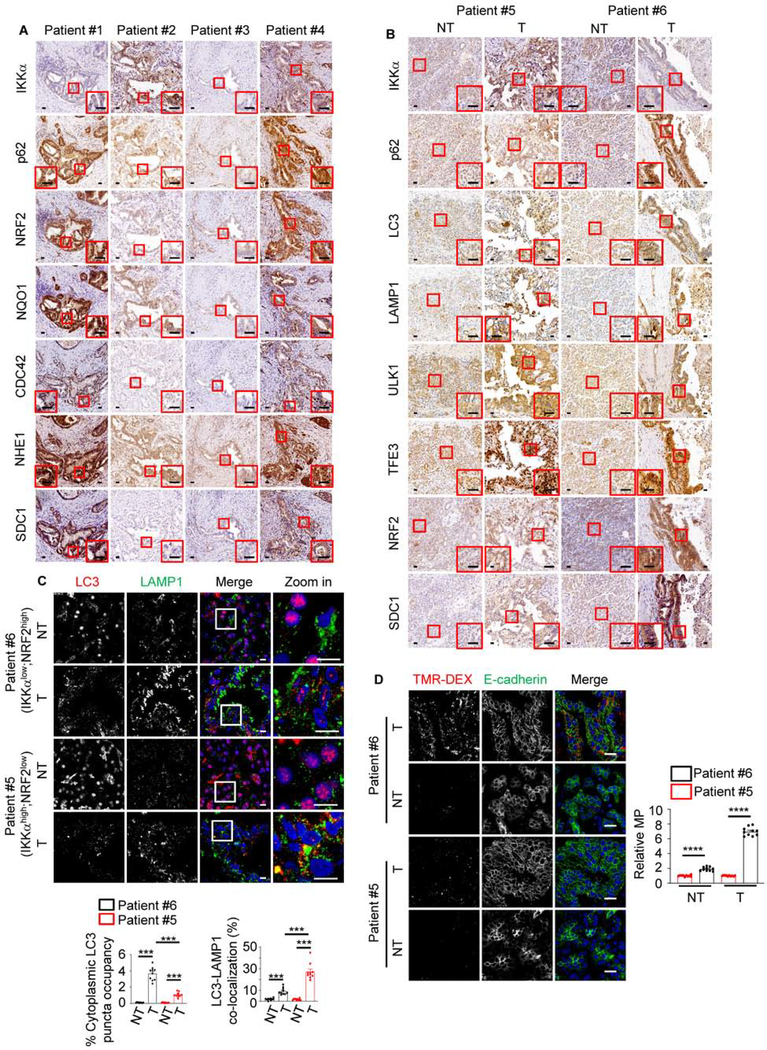
Figure 4. MP is Upregulated in NRF2high Human PDAC.
(A) Representative immunohistochemical (IHC) analysis of human PDAC tissues. The areas marked by the squares were further magnified. Scale bars, 25 μm.
(B) Representative IHC of non-tumor (NT) and tumor (T) areas in IKKαhigh (patient #5) and IKKαlow (patient #6) human PDAC specimens. Marked areas were examined under higher magnification. Scale bars, 25 μm.
(C) Imaging and quantification (on the bottom) of LC3 puncta and LC3-LAMP1 co-localization in above specimens. Mean ± SEM (n=10 patients). Statistical significance was determined by a 2-tailed t-test; ***p < 0.001. Scale bars, 10 μm
(D) Representative images and MP quantification (on the right) in TMR-DEX injected fresh surgical specimens from patients #5 (IKKαhigh;NRF2low tumor) and #6 (IKKαlow;NRF2high tumor). PEC or carcinoma cells are marked by E-cadherin staining. Scale bar, 20 μm. Mean ± SEM (n=10). ****p < 0.0001.
See also Figure S5.

