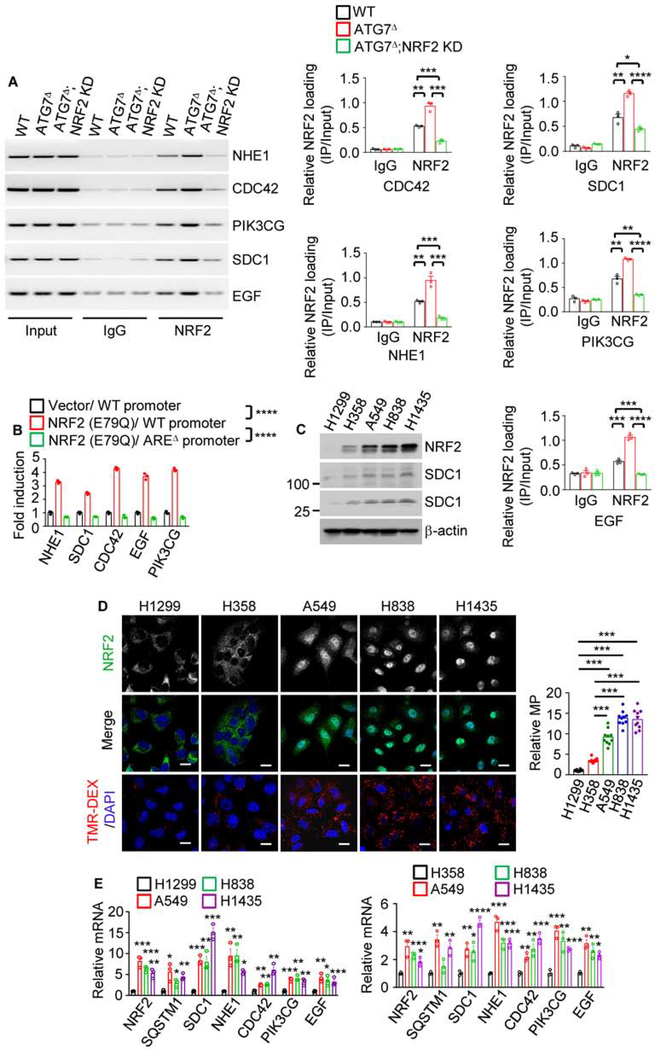
Figure 5. NRF2 Transcriptionally Controls MP.
(A) ChIP assays probing NRF2 recruitment to the NHE1, CDC42, PIK3CG, SDC1, and EGF promoters in WT, ATG7Δ and ATG7Δ;NRF2 KD MIA PaCa-2 cells. The image shows PCR-amplified promoter DNA fragments containing NRF2 binding sites (AREs). Quantitation is on the right.
(B) Activation of reporters controlled by WT and AREΔ promoter regions of above genes. pGL3-WT or AREΔ promoters fused to a luciferase reporter were co-transfected into MIA PaCa-2 cells +/− NRF2 expression vector and pRL-TK control reporter. The figure shows relative fold-activation by NRF2.
(C) IB analysis of NRF2 and SDC1 in lung cancer cell lines.
(D) Macropinosome and NRF2 imaging in human lung cancer cell lines. Quantitation is on the right. Scale bar, 10 μm. Relative macropinocytic uptake, mean ± SEM (n=10).
(E) qRT-PCR analysis of MP-related mRNAs in above cells.
Results in (A), (B) and (E) are mean ± SEM (n=3 independent experiments). Statistical significance in (A), (B), (D) or (E) was determined by a 2-tailed t-test. *p < 0.05, **p < 0.01, ***p < 0.001, **** p < 0.0001.
See also Figure S6.

