
Figure 2:
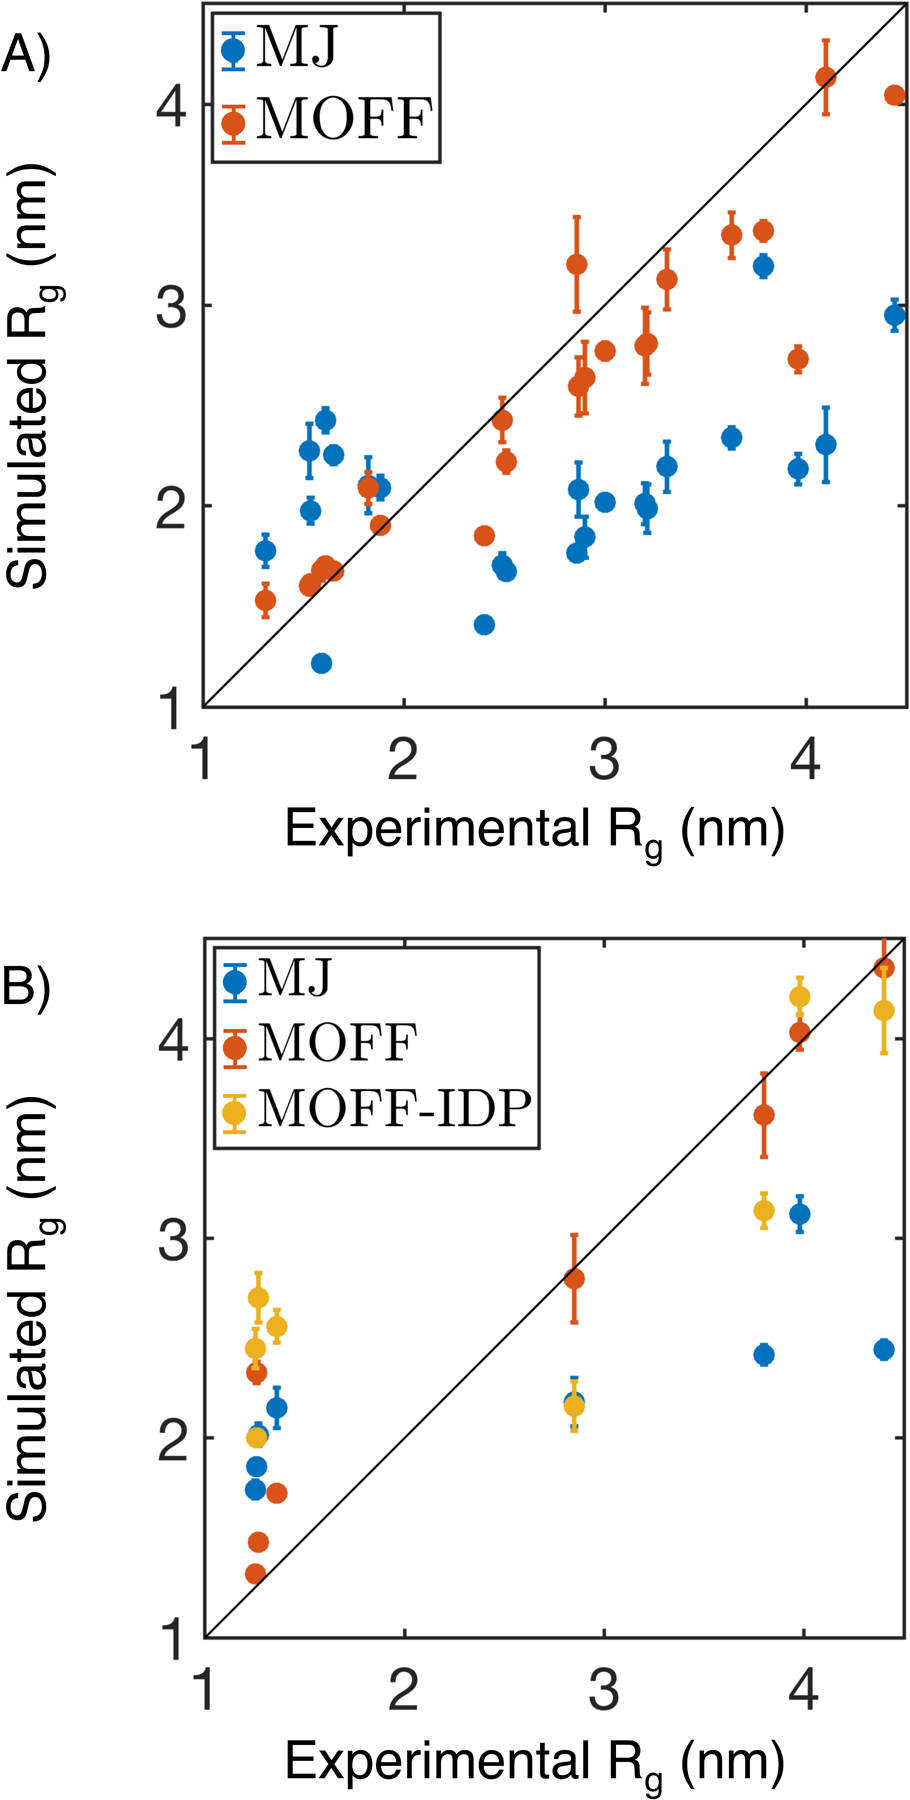
Comparison between experimental and simulated radius of gyration (Rg) for protein molecules in the training (A) and validation (B) set. In addition to the force field introduced in this paper (MOFF, orange), we included simulation results using the Miyazawa-Jernigan potential (MJ, blue) and a previous version of MOFF optimized for IDPs (MOFF-IDP, yellow) as well. Error bars represent standard deviation after block averaging.