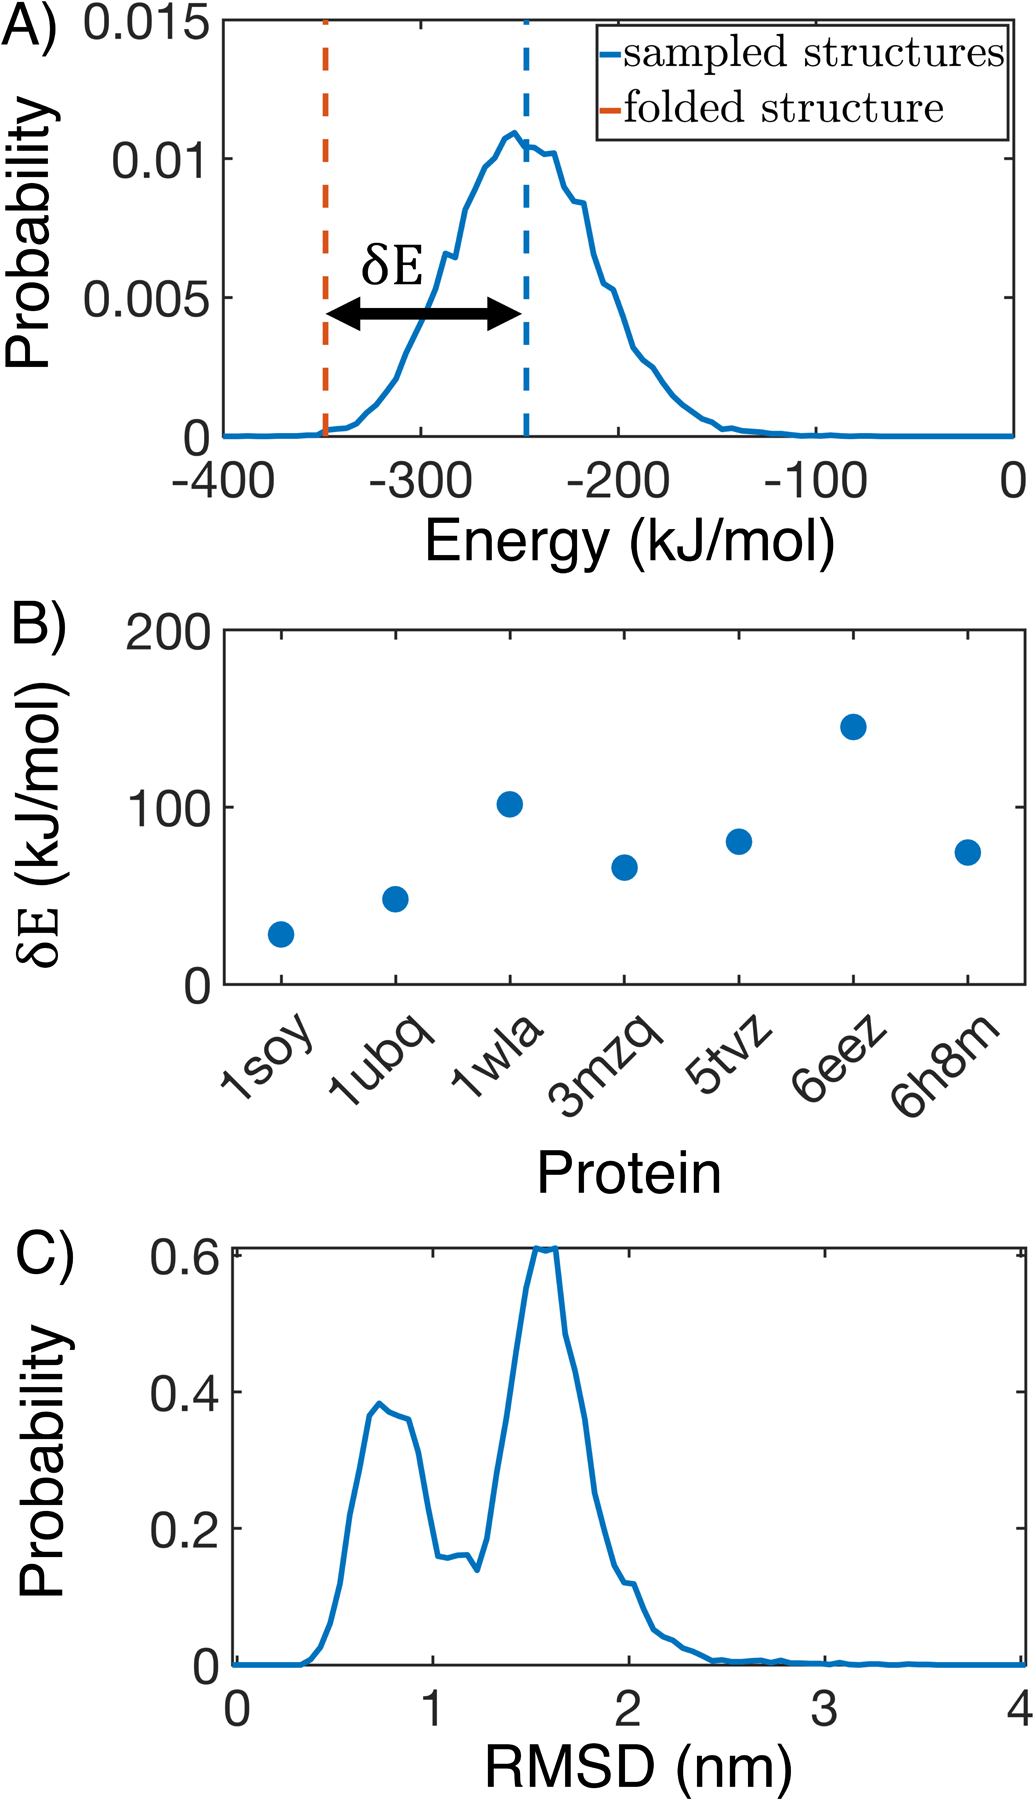
Figure 3:

MOFF succeeds in creating energy gaps for folded proteins. (A) Contact energy of the folded structure (orange) relative to those sampled in simulation (blue) for 1wla. The energy gap δE is defined as the difference between the folded energy and the average simulated energy. (B) δE for all folded proteins in the training set. (C) Probability distribution of the root mean squared displacement (RMSD) relative to the folded structure for 1wla at 300 K.
