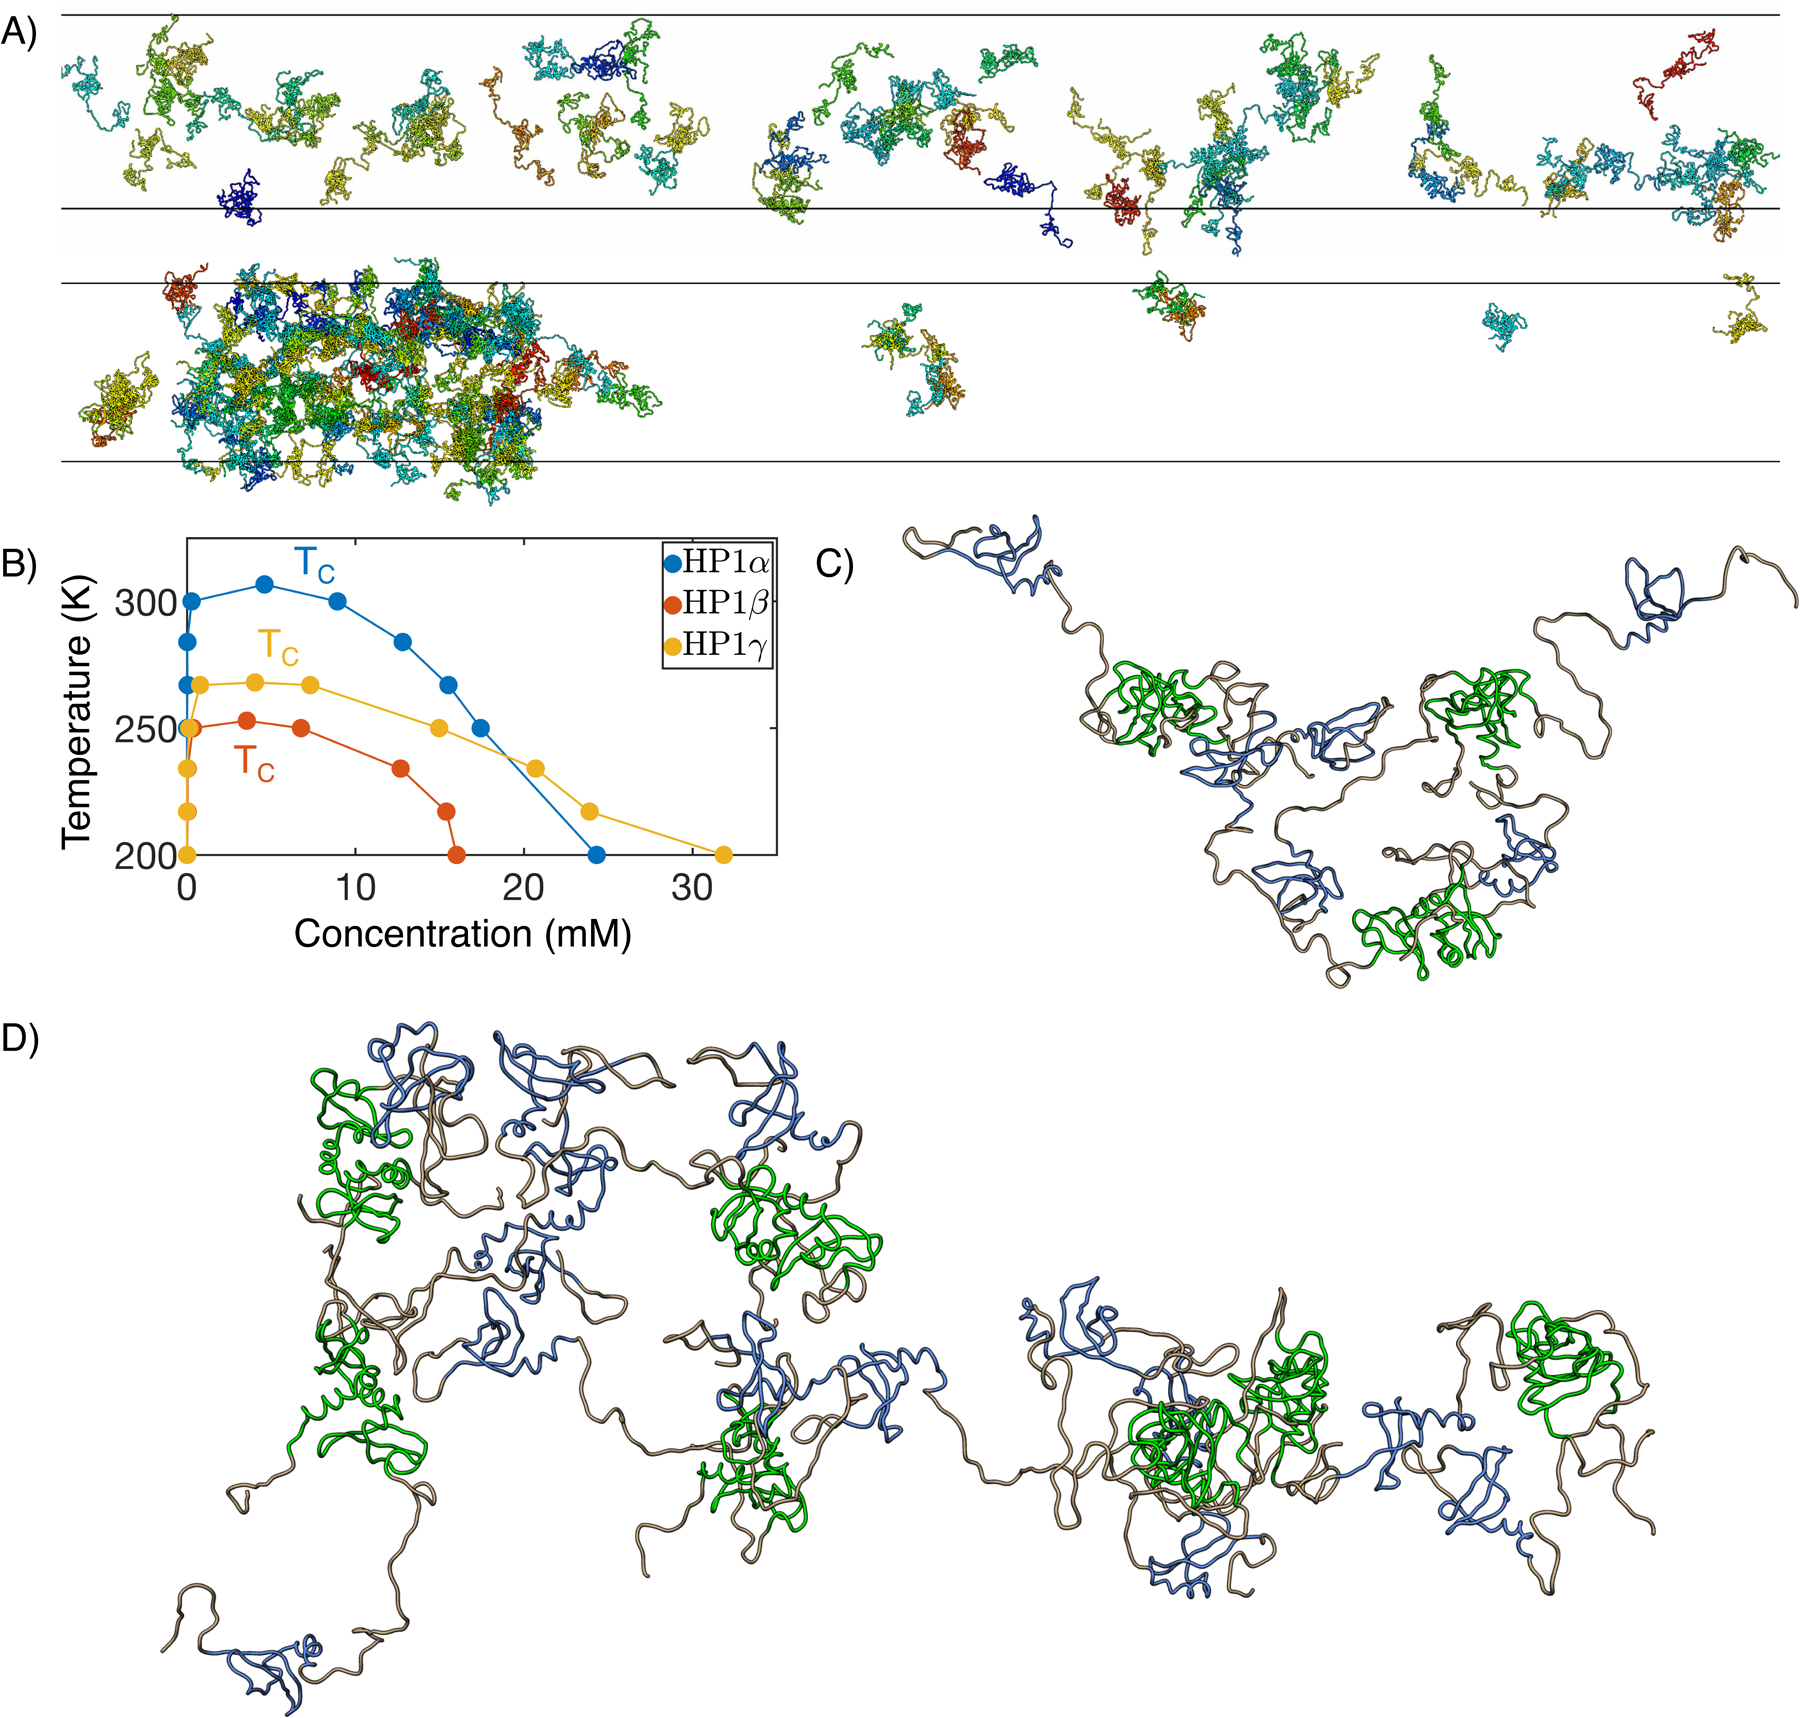
Figure 7:

MOFF enables quantitative simulations of HP1 phase separation. (A) Example configurations from slab simulations of HP1α at 350 (top) and 300 (bottom) K. (B) Phase diagram and critical temperature for HP1α (blue), HP1β (orange), and HP1γ (yellow). (C, D) Representative cluster structures formed with three (C) and seven (D) HP1α dimers. The coloring scheme is the same as in Figure 6A.
