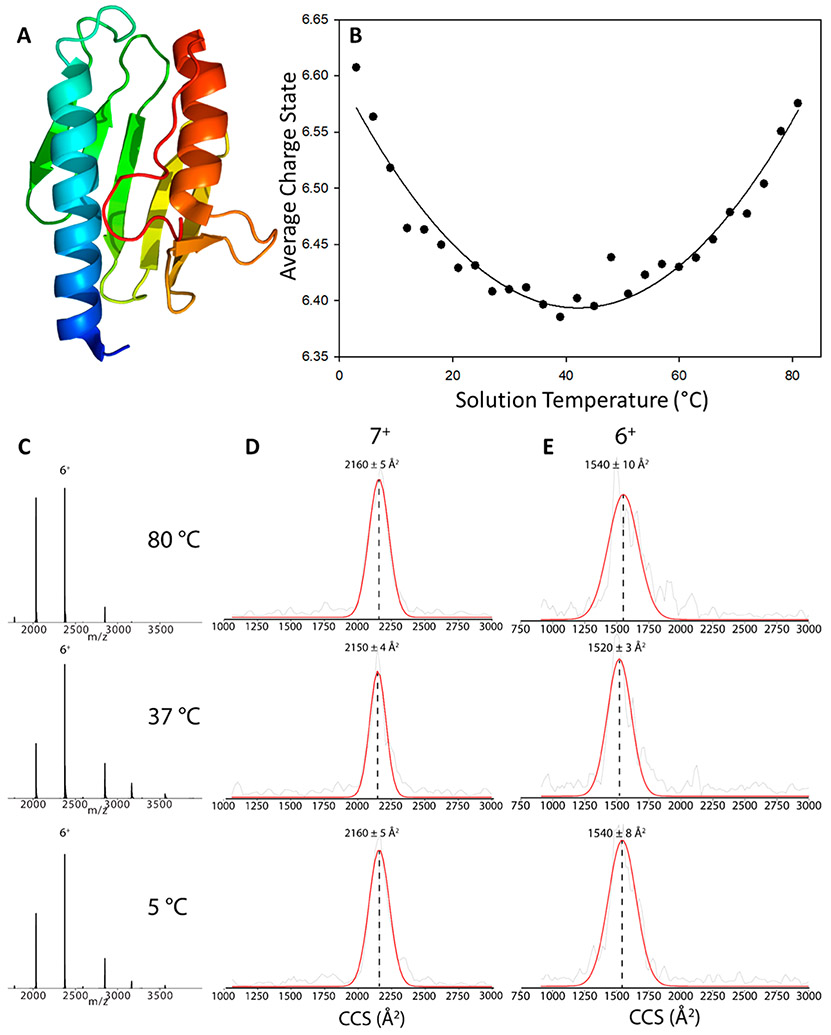
Figure 3.
(A) Structure of human frataxin (PDB: 1EKG)64 and (B) plot of the average charge state (Zavg) of frataxin as a function of solution temperature in the ESI emitter. The ESI signal is unstable at T > 82 °C, presumably owing to decomposition and/or aggregation at higher temperatures. A parabolic fit (Sigmaplot 10.0, solid line) was added to the data. vT-IM-Orbitrap CCS profiles and (C) extract MS of the (D) 7+ charge state and (E) 6+ charge state of FXN at 5 °C, 37 °C, and 80 °C. The red line is a Gaussian function fitted to the raw CCS experimental data (gray). CCS values for the 5+ monomer are not shown due to the overlap with the 10+ dimer.

