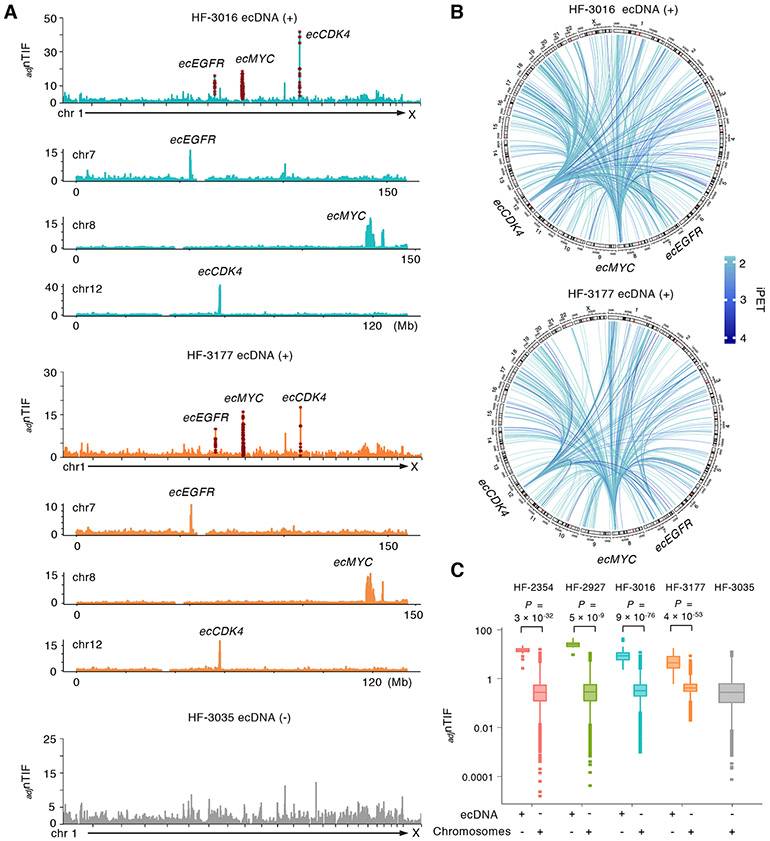
Figure 2. EcDNA signatures can be distinguished by the high chromosomal interaction frequency (adjnTIF) across 23 chromosomes.
(A) Distribution of genome-wide adjnTIFs at 50-Kb resolution in the ecDNA (+) HF-3016 and HF-3177 cell lines in comparison with the ecDNA (−) HF-3035 line. Elevated adjnTIFs are observed on the chromosomes 7, 8 and 12 regions known to be amplified on ecDNAs. Distributions of adjnTIFs along the chromosomes 7, 8 and 12 are shown and regions with elevated adjnTIF values are well-matched with known ecEGFR, ecMYC and ecCDK4 regions.
(B) Circos plots of the interactions mediated by ecDNA regions across all 23 chromosomes in HF-3016 and HF-3177 ecDNA (+) cell lines. Extensive connections between ecMYC, ecEGFR and ecCDK4 regions are shown.
(C) Box plot displays the adjnTIFs between the known ecDNA regions and chromosomal background in four ecDNA (+) cell lines. Statistical analyses by one-sided Wilcoxon Rank-Sum Test. For boxplots, center line, median; boxes, first and third quartiles; whiskers, 1.5 × the interquartile range (IQR); points, outliers.

