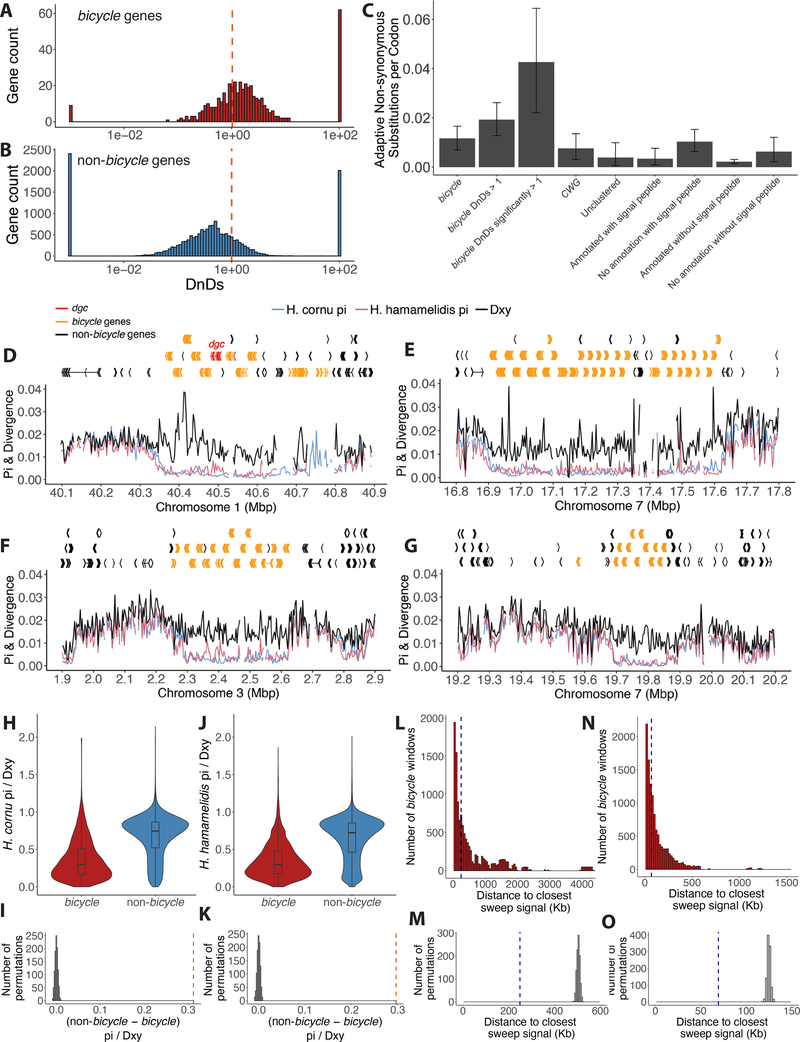
Figure 7. Genome-wide signals of selective sweeps are enriched near bicycle genes.
(A) The majority of bicycle genes display dN/dS values great than 1, with few showing strong sequence conservation (dN/dS <<1). Dashed vertical red line indicates dN/dS = 1.
(B) Non-bicycle genes are more conserved, on average, than bicycle genes (Mann-Whitney U test p=2.6e-76. Dashed vertical red line indicates dN/dS = 1.
(C) Mean number of adaptive non-synonymous substitutions scaled by protein length for different categories of genes over-expressed in fundatrix salivary glands. As a proportion of protein length, bicycle genes display the fastest rate of adaptive evolution of any category of these genes. Error bars represent 95% confidence intervals. Note that the four categories on the right include all genes shown on the left, but categorized by whether genes were annotated and included a signal peptide. Thus, for example, the category “No annotation with signal peptide” is composed mostly of bicycle and CWG genes.
(D-G) Gene models and population genomic statistics for the 800 kb dgc bicycle gene cluster (D) and for three additional genomic regions containing bicycle gene clusters (E-G). Divergence between (black line) and polymorphism within H. cornu (blue line) and H. hamamelidis (pink line) in 3000bp windows shown below gene models.
(H and J) Ratio of Pi to Dxy for bicycle and non-bicycle gene regions in H. cornu (H) and H. hamamelidis (J).
(I and K) The observed difference in Pi/Dxy between non-bicycle and bicycle genes (dashed red line) is much larger than the expectation generated by permuting the locations of Pi/Dxy values relative to gene locations for both H. cornu (I) and H. hamamelidis (K).
(L and N) Distance from each bicycle gene to the closest significant selective sweep signal is shown as red histogram and dashed blue line indicates the median of this distribution for H. cornu (L) and H. hamamelidis (N).
(M and O) The median distance from each bicycle gene to the closest significant selective sweep signal from (L) for H. cornu (M) and from (N) for H. hamamelidis (O) is shown with dashed blue line and the values after 1000 permutations of sweep signals relative to gene locations are shown as grey histograms. The observed sweep signals are closer to bicycle genes than expected by chance.
See also Figures S6 and S7 and Tables S1 and S2.

