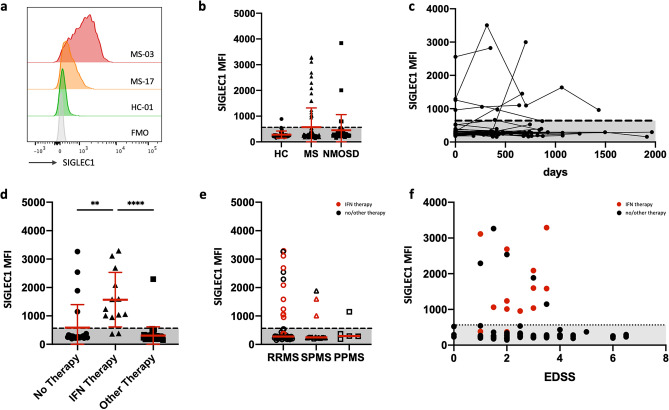
Figure 1.
(a) Representative histograms of SIGLEC1 fluorescence on CD14high monocytes, FMO: fluorescence minus one control. (b) Cross-sectional analysis of SIGLEC1 expression on CD14high monocytes of 31 healthy controls, 86 MS patients and 41 NMOSD patients. If multiple samples of the same individual were analysed, the mean of the measurements is displayed. (c) Longitudinal analysis of SIGLEC1 expression of 52 individuals with up to five measurements. (d) Comparison of SIGLEC1 expression in MS patients, receiving no immunomodulatory treatment (n = 24), interferon beta (n = 13) or a non-interferon treatment (n = 49). Treatment with interferon with significantly associated with higher levels of SIGLEC1 expression: Kruskal–Wallis test with Dunn’s correction, **p < 0.01, ****p < 0.0001. (e) Comparison of SIGLEC1 expression in patients with RRMS (n = 63), SPMS (n = 15) and PPMS (n = 5). Red symbols indicate interferon treatment. (f) Scatter plot of the EDSS disability score against SIGLEC1 expression, no significant correlation was detected.

