Figure 5.
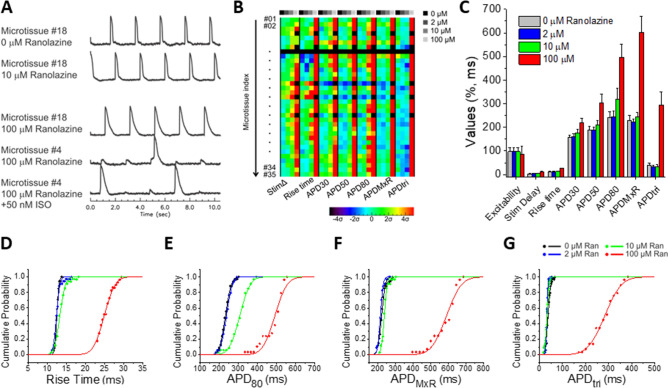
Dose-dependent effects of ranolazine on AP manifested at high concentrations above the therapeutic window in hiPSC-CMLP with 5% hCF microtissues. (A) Representative Vm traces from 0, 10, 100 μM ranolazine, and 100 μM ranolazine plus 50 nM ISO show AP stability at 10 μM and instability in microtissues exposed to 100 μM Ran with or without ISO . (B) AP metric color map shows each microtissue (rows) and seven AP metrics (major columns) with dose-dependent response at indicated concentrations (minor columns). The color displayed shows shifts as measured by the standard deviation (σ) from the average value of the AP metric under the control condition (0 μM). Increases appear in the warm color spectrum (progressing yellow-orange-red) and decreases appear in the cool color spectrum (progressing cyan-blue-purple). Black indicates non-excitable microtissues. When excitability is lost in a microtissue, other metrics could not be measured. (C) A summary bar graph for all eight AP metrics shows dose-dependent changes. Values are means ± SD (n = 35). See Supplemental Table 1 (top) for p values. (D-G) Cumulative probability plots for rise time (D), APD80 (E), APDMxR (F), and APDtri (G) show relative stability up to 10 μM and marked changes and increased variability (shown by the reduced slope of the curve) at 100 μM ranolazine.

