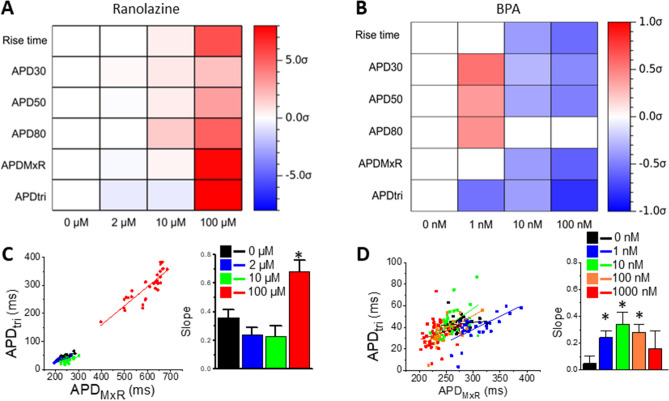
Figure 7.
Characteristic AP metric changes induced by Ranolazine and BPA. The color maps of mean difference AP metrics by ranolazine (A) and BPA (B). The mean differences of AP metrics were normalized by each metric’s standard deviation in control (σCTR). Statistically significant increase and decrease (p < 0.05, paired t-test) are presented by red and blue color, respectively. (C,D) APDtri versus APDMxR plots in response to increasing concentrations of ranolazine (C) and BPA (D; * p < 0.01).

