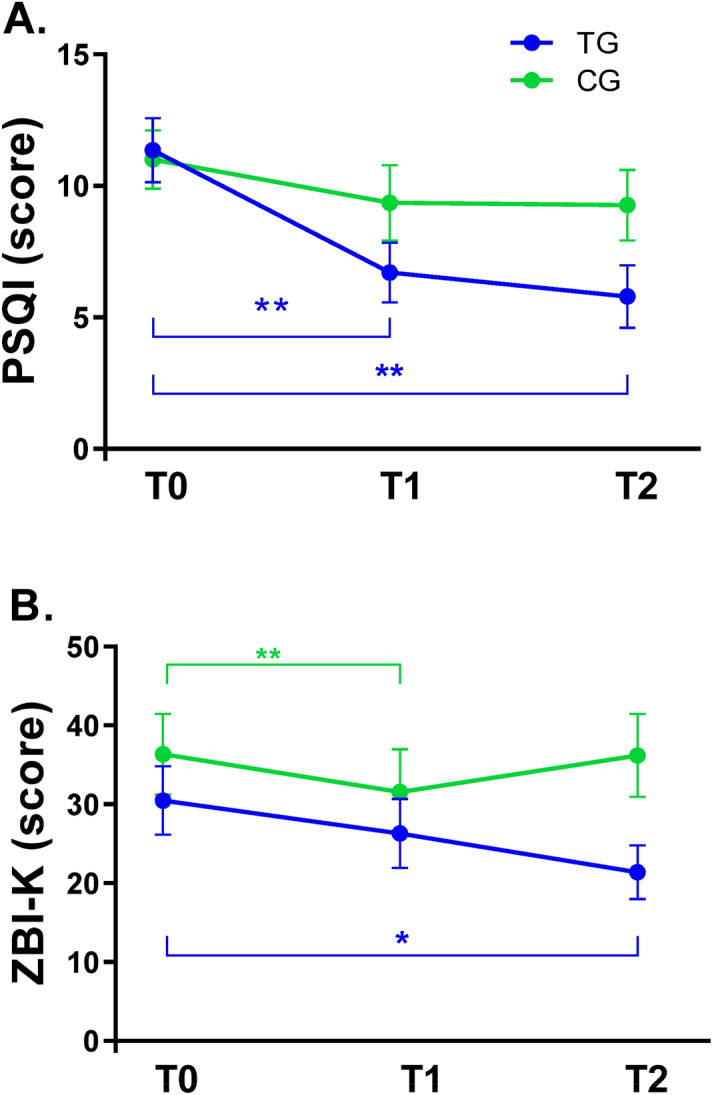
Figure 3.

Pittsburgh Sleep Quality Index (PSQI) (A) and Korean version of Zarit Burden Interview (ZBI-K) (B) scores before and after timed blue enriched white light treatment in the treatment group (TG) (N = 14) and control group (CG) (N = 11). T0 baseline, T1 immediate post-treatment, T2 4 weeks after the end of the 2 weeks of light treatment. The mean scores for the PSQI and ZBI-K at T1 and T2 were compared to those at T0. The plots indicate mean ± SEM, *p < 0.05, **p < 0.01 (paired t-test).
