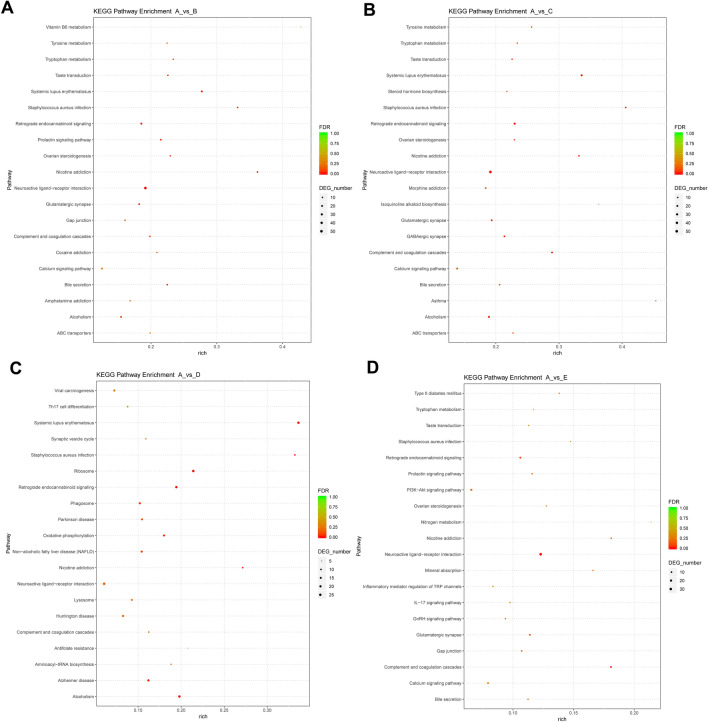
Figure 4.
KEGG enrichment analysis for DE genes. (A–D) Top 20 KEGG pathways enriched by DE genes in B vs A, C vs A, D vs A, and E vs A groups, respectively. Pathway in the Y-axis represents the KEGG pathway term enriched by differentially expressed genes. The “rich” in the X-axis represents the rich factor. Rich factor: the number of differentially expressed genes in the pathway term/the number of all annotated genes in the pathway term. FDR: P value after the correction of False Discovery Rate (FDR). DEG_number: number of differentially expressed genes in the KEGG pathway term. KEGG enrichment analysis was performed as previously described48–50.

