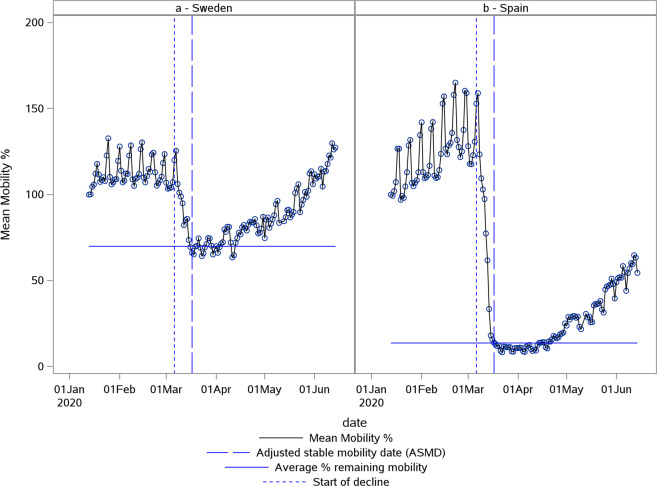
Fig. 1. Largest and smallest % mobility lost.
Plot of Apple normalized mobility data in % deviation from baseline. The smallest % mobility lost was observed for Sweden (a). The largest % mobility lost was observed for Spain (b). The first vertical (blue small) dotted line indicates the estimated start of decline. The second vertical (blue large) dotted line indicates the adjusted stable mobility date (ASMD). The horizontal line indicates the estimate for average % remaining mobility.

