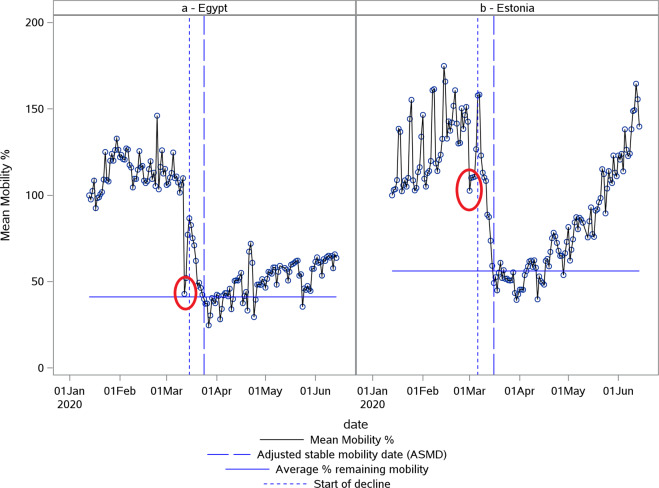
Fig. 7. Examples of effects of significant events on mobility.
Plot of Apple normalized mobility data in % deviation from baseline indicating the Egypt flood just before lockdown (a) and the elections in Estonia (b). The first vertical (blue small) dotted line indicates the estimated start of decline. The second vertical (blue large) dotted line indicates the adjusted stable mobility date (ASMD). The horizontal line indicates the estimate for average % remaining mobility. Red circles mark atypical events, flooding in (a) and elections in (b).

