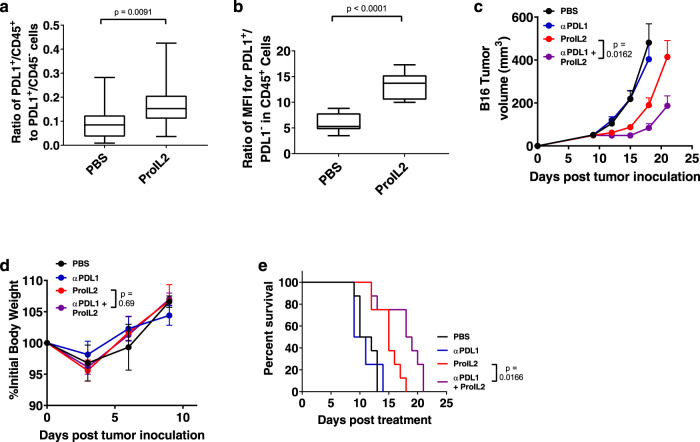
Fig. 6. ProIL2 can overcome tumor resistance to ICB.
a, b B16 s.c. tumor-bearing mice were injected i.p. with PBS or ProIL2 (300 pmol) one time on day 9 post tumor inoculation. 72 h after treatment, mice were euthanized and tumors were extracted, digested in collagenase/DNAse, and resuspended as single cells. Flow cytometry was used to quantify the amount of PDL1+ and CD45+ cells. In CD45+ cells, the MFI of PDL1+ and PDL1- cells were compared. Box and whisker plots with maxima, 75th percentile, center, 25th percentile, and minima are displayed (n = 3 experiments, total 12 individual mice per group). c, d B16 s.c. tumor-bearing mice were injected i.p. with PBS, anti-PDL1 (200 μg each), ProIL2 (300 pmol), or anti-PDL1 and ProIL2 one time on day 9 post tumor inoculation; tumor growth and body weight were measured (n = 3 experiments, total 12 individual mice for PBS and ProIL2 treatment groups, 13 for anti-PDL1 and combination groups). e Mice were analyzed for survival starting the day after treatment. For mouse health, mice were euthanized when tumors reached a volume of greater than 1000 mm3 (n = 2 experiments, total 8 individual mice per group). Data represent mean ± s.e.m. Student’s t tests (a–d) or log-rank tests (e) were performed to calculate p values. Source data are provided as a Source Data file.

