Figure 3.
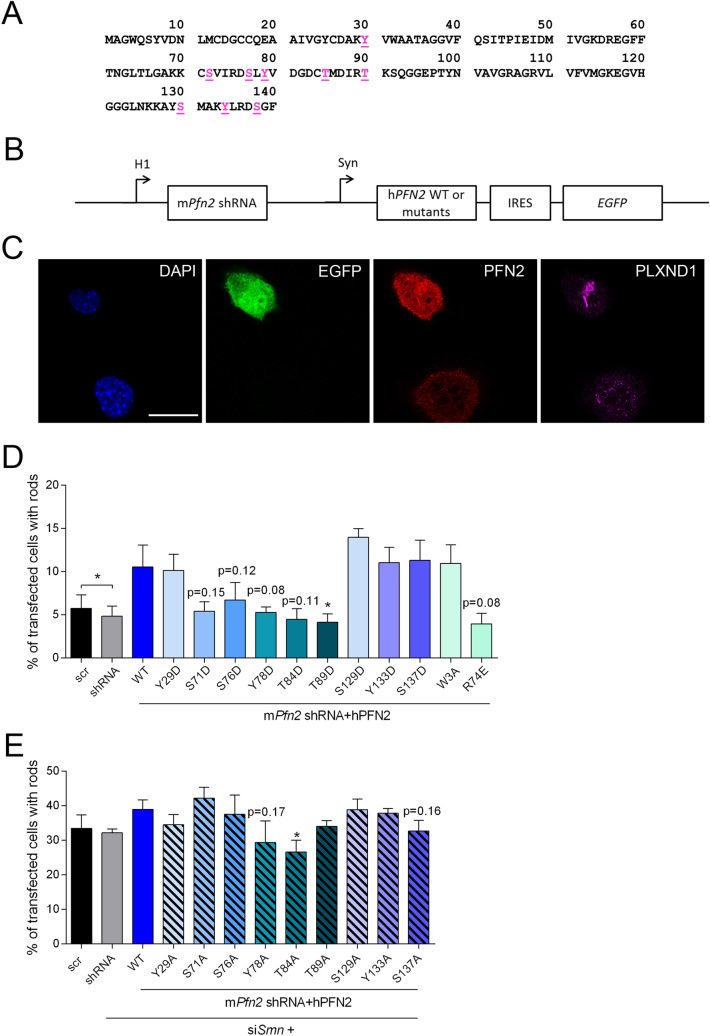
Single-site phosphorylation of profilin2 shows only minor effects on rod formation. (A) Primary structure of human PFN2 with putative phosphorylation sites (magenta). (B) Schematic drawing of a bicistronic plasmid for knock-down of endogenous mPFN2 and overexpression of hPFN2 WT and mutants, respectively. The EGFP gene was molecularly cloned under the control of an IRES sequence to function as a transfection control. (C) Confocal images of NSC34 cells transfected with the plasmid of (B) comprising the coding sequence of hPFN2 WT. Cells were stained with PFN2 and PLXND1 antibody. DAPI was used as nuclear staining. Scale bar: 20 µm. (D) Quantification of rod-containing cells transfected with the bicistronic plasmids comprising the coding sequences for hPFN2 phospho-mimetics (D-mutants) (mean ± SEM, n = 5 independent biological replicates, paired two-tailed t-tests in comparison to WT if not otherwise indicated, *p < 0.05). The following cell numbers were counted for each replicate: #1: 89–214 cells; #2: 108–238 cells; #3: 77–249 cells; #4: 95–235 cells; #5. 115–225 cells. (E) Quantification of cells with rods after co-transfection with siSmn and the bicistronic plasmids comprising the coding sequences of hPFN2 phospho-mutants (A-mutants) (mean ± SEM, n = 4 independent biological replicates, paired two-tailed t-tests in comparison to WT, *p < 0.05). The following cell numbers were counted for each replicate: #1: 75–144 cells; #2: 81–154 cells; #3: 90–179 cells; #4: 102–146 cells.

