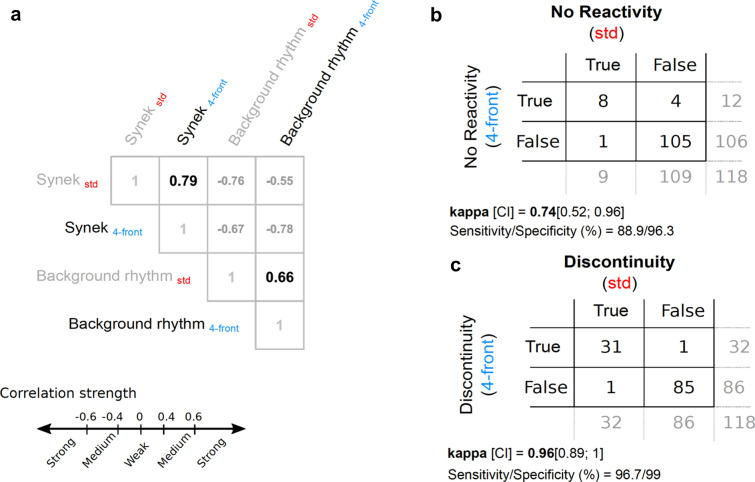
Fig.2.
Similarity between EEG variables computed from the standard and frontal montages. a Spearman correlation matrix showing strong association between standard (std, red fonts) and frontal (4-front, blue fonts) derived Synek score (ρ = 0.79, p < 0.001). On the same matrix, we also show strong association between std and 4-front estimated background rhythm (ρ = 0.66, p < 0.001). Confusion tables between std and 4-front montages computed for the absence of reactivity (b) and the discontinuity (c)

