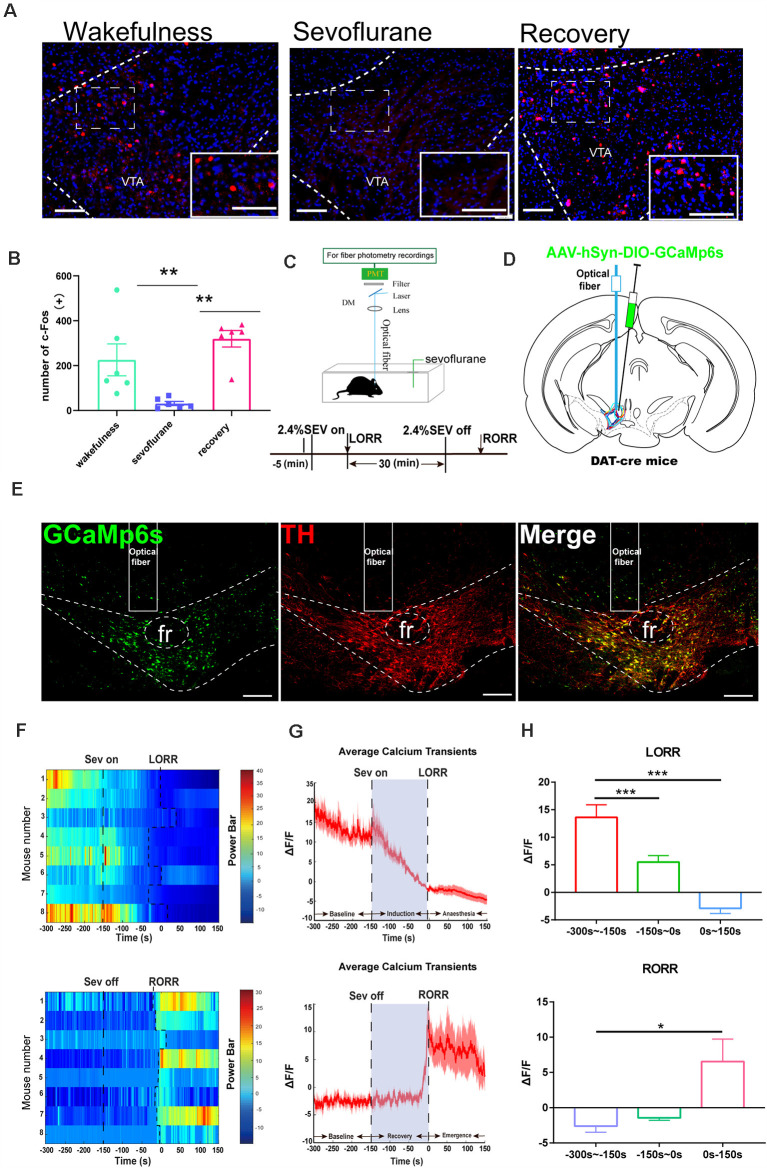
Figure 1.
Ventral tegmental area (VTA)-dopamine (DA) activity and neural dynamics in response to sevoflurane. (A) Expression of c-Fos in the VTA in the wakefulness state, sevoflurane anesthesia and recovery from anesthesia in mice (Scale bars: 200 μm). (B) Average number of c-Fos-immunopositive neurons. One-way analysis of variance (ANOVA) followed by post hoc Bonferroni’s test (n = 6). **p < 0.01. (C) Schematic configuration of in vivo Ca2+ signal recording. Timeline for Ca2+ signal recording in sevoflurane anesthesia. (D) Expression of GCaMP6s in VTA from each cases are outlined. (E) Expression of GCaMP6s in VTA-DA neurons. Viral expression (GCaMP6s, green) in the VTA and colabeling with DA neurons (TH immunofluorescence, red; Scale bars: 200 μm). (F) Heat map illustrating changes in the Ca2+ signals related to sevoflurane-induced LORR and RORR. (G) Average calcium transients associated with loss of righting reflex (LORR) and recovery of righting reflex (RORR) mean (red trace) ± SEM (red shading). Note that the Ca2+signals gradually decreased during the LORR process and increased sharply after RORR. (H) ΔF/F represents the deviation in Ca2+ fluorescence from the baseline, which is the averaged ΔF/F between t = –300 s and –150 s. Data are presented as the mean ± SEM. *p < 0.05; **p < 0.01; ***p < 0.001, n = 8, by paired t-test.

