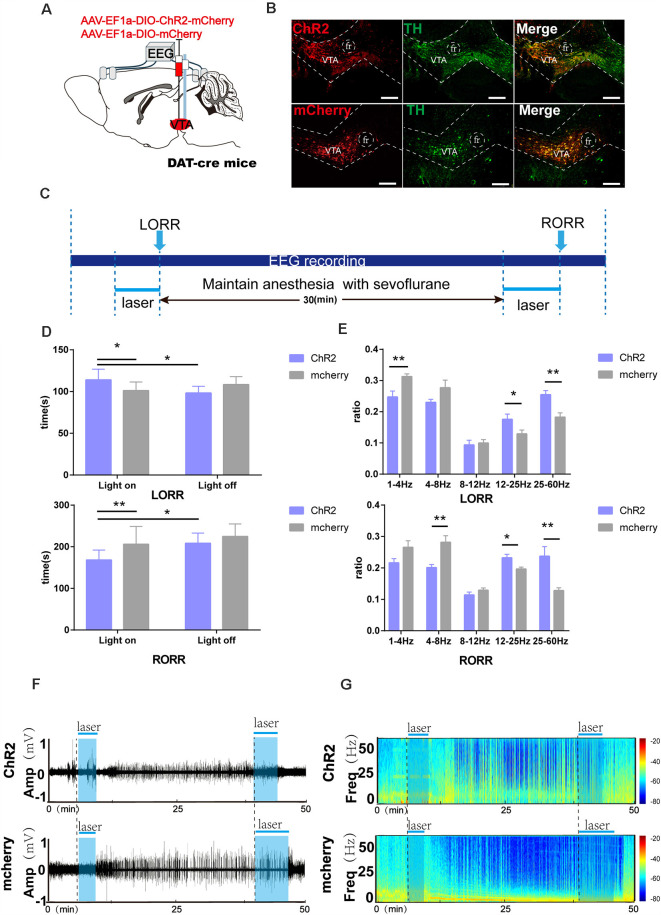
Figure 2.
Optogenetic activation of VTA-DA neurons facilitates arousal from sevoflurane anesthesia. (A) Diagram of the optogenetic virus injection and stimulation sites. (B) Expression of virus (mCherry, red) in VTA-DA neurons and colabeling with DA (TH immunofluorescence, green; scale bar: 200 μm). (C) Schematic of the experimental time-course. (D) Optical activation of DA neurons in the VTA prolonged the induction time and shortened the emergence time from sevoflurane anesthesia. (E) Comparison of each Electroencephalogram (EEG) frequency band between the two groups during optogenetic activation of VTA-DA neurons. (F,G) Representative EEG traces and the corresponding heat map of the process in the two groups. Data are presented as the mean ± SD. *p < 0.05; **p < 0.01, n = 8, by paired and unpaired t-test.

