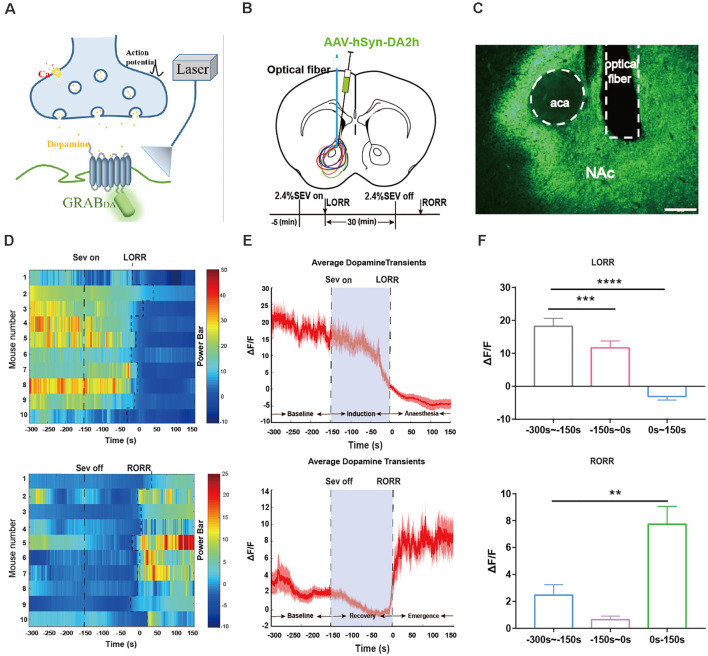
Figure 3.
Dynamics of extracellular dopamine in the nucleus accumbens (NAc) in response to sevoflurane anesthesia. (A) Schematic diagram depicting the fiber photometry recording of extracellular dopamine. (B) Expression of DA2 h in NAc from each cases are outlined. Timeline for dynamics of extracellular dopamine recording in sevoflurane anesthesia. (C) Expression of the DA2h virus in the NAc area (Scale bars: 200 μm). (D) Heat map illustrating the changes in the DA fluorescence signals related to sevoflurane-induced LORR and RORR. (E) Average DA transmitters transients associated with LORR and RORR; mean (red trace) ± SEM (red shading). Note that the extracellular DA fluorescence signals gradually decreased with LORR and increased sharply after RORR. (F) ΔF/F represents the deviation in the DA transmitter signal from the baseline, which is the averaged ΔF/F between t = –300 s and –150 s. Data are presented as the mean ± SEM. **p < 0.01; ***p < 0.001; ****p < 0.0001, n = 10, by paired t-test.

