Figure 7.
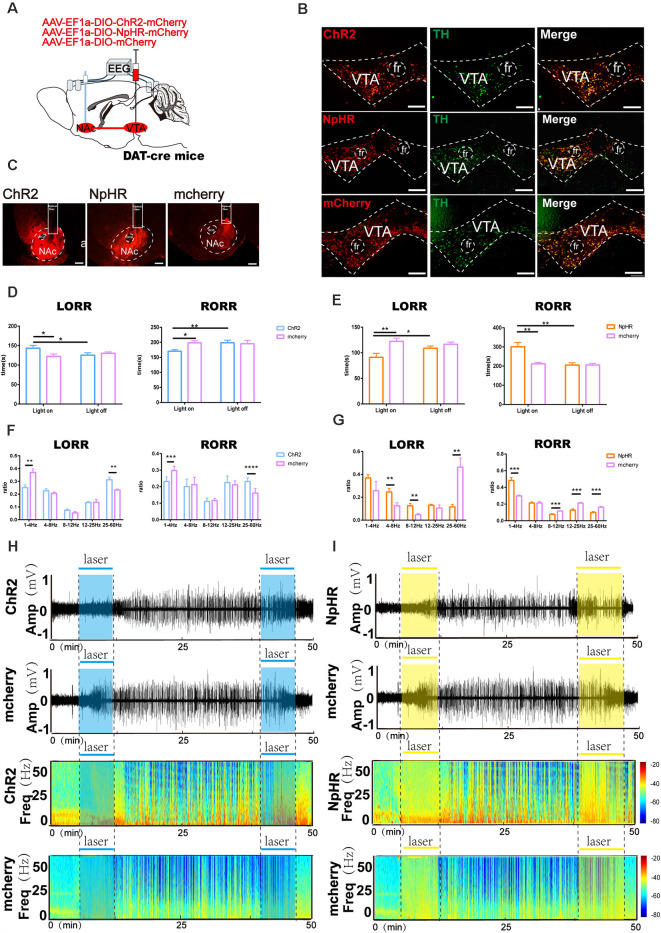
Optogenetic activation or inhibition of VTADA-NAc projections modulate the process of sevoflurane anesthesia. (A) Schematic of optogenetic virus injection and stimulation sites. (B) Expression of ChR2/NpHR/mCherry (red) and TH immunofluorescence (green) in the VTA. (C) Expression of VTA-DA neuron terminals in the NAc. (D) Optical stimulation of VTA dopaminergic projections in the NAc prolonged the induction time and reduced the emergence time. (E) Optical inhibition of dopaminergic terminals in the NAc reduced the induction time and prolonged the emergence time. (F) Optogenetic activation of dopaminergic terminals mediated the band distribution of EEG power during both the LORR and RORR process. (G) Optogenetic inhibition of VTA dopaminergic projection to the NAc mediated the band distribution of EEG power during both the LORR and RORR processes. (H,I) Representative EEG traces and heat map from each group. Data are presented as the mean ± SD. *p < 0.05, **p < 0.01, ***p < 0.001, and ****p < 0.0001, n = 8, by paired and unpaired t-test.

