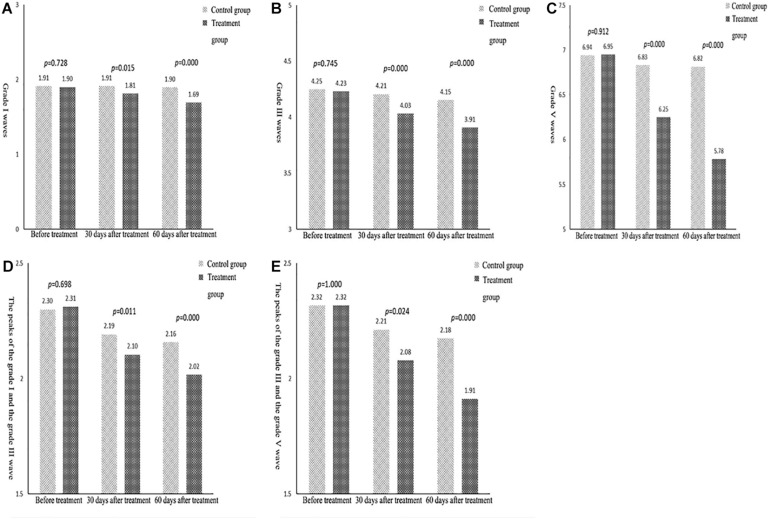
FIGURE 3.
(A) Comparison of the mean indexes of grade I waves between the two groups. (B) Comparison of the mean indexes of grade III waves between the two groups. (C) Comparison of the mean indexes of grade V waves between the two groups. (D) Comparison of the mean indexes of grade I–III waves between the two groups. (E) Comparison of the mean indexes of grade III–V waves between the two groups.

