Figure 3.
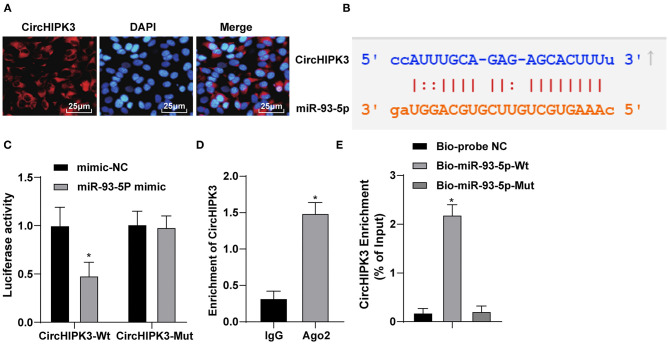
CircHIPK3 sponges miR-93-5p as a ceRNA. (A) RNA-FISH was used to detect the subcellular localization of CircHIPK3. (B) Bioinformatic website predicted the binding relationship between CircHIPK3 and miR-93-5p. (C) Dual-luciferase reporter gene assay was used to verify the binding relationship between CircHIPK3 and miR-93-5p. (D) RIP assay was used to detect the relationship between CircHIPK3 and Ago2. (E) RNA pull-down test was used to verify the binding of CircHIPK3 and miR-93-5p. The value in the figures is the measurement data, which is expressed as mean ± standard deviation. The comparison between two groups was analyzed by independent-sample t-test. The comparison among multiple groups was analyzed by one-way ANOVA, followed by Tukey's multiple-comparisons test, *p < 0.05. The experiment was repeated three times.

