FIGURE 5.
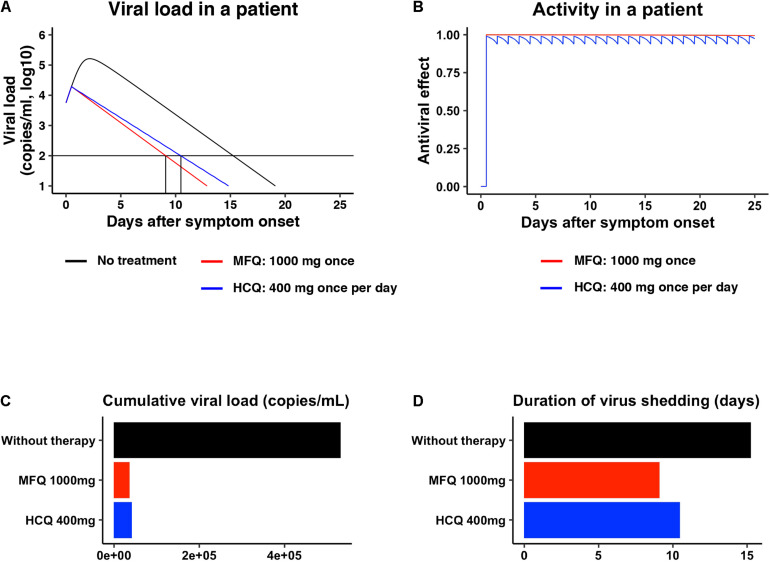
Prediction of the impact of MFQ and HCQ treatment on SARS-CoV-2 dynamics in clinical settings. (A,B) The predicted viral load dynamics without (A, black), upon MFQ (1,000 mg oral, once) (A, red) or upon HCQ (400 mg oral, once per day) (A, blue) administration and the time-dependent antiviral activity of MFQ and HCQ (B) predicted by pharmacokinetics/pharmacodynamics/viral-dynamics (PK/PD/VD) models. (C,D) The cumulative viral load calculated as the area under the curve in (A) and the duration of virus shedding (days) [time from symptom onset to the day achieving a viral load under the detection limit (black horizontal line) in (A)] were evaluated for non-treatment (black), MFQ treatment (red) or HCQ treatment (blue).

