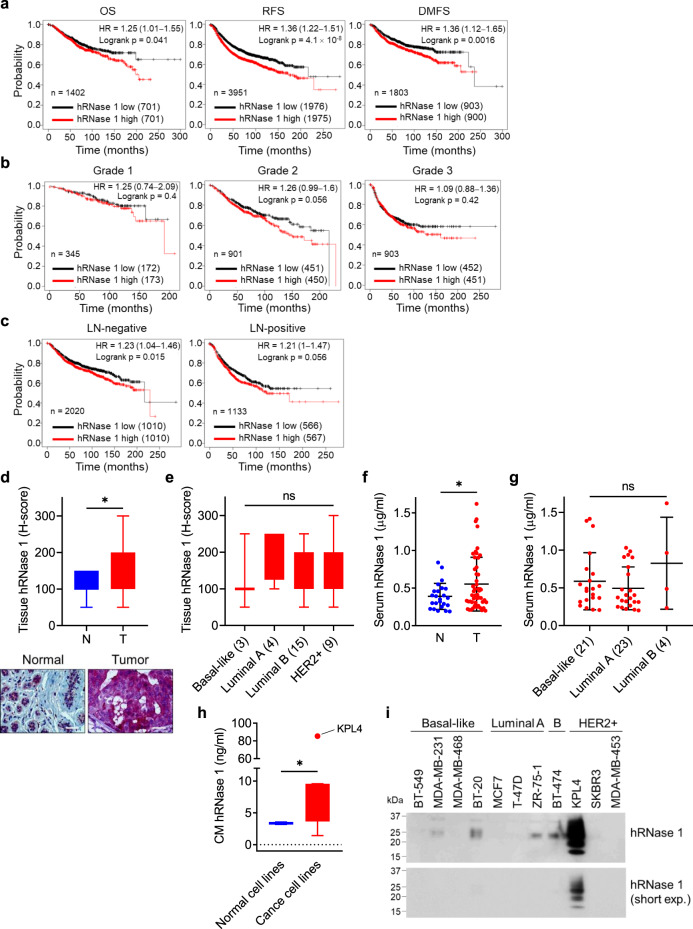
Fig. 1. High hRNase 1 expression predicts poor clinical outcome in breast cancer patients.
a, Prognostic correlation of survival analyses of breast cancer patients with high and low hRNase 1 levels. OS, overall survival; RFS, relapse-free survival; DMFS, distant-metastasis-free survival. HR, hazard ratio. b, c Prognostic correlation of the RFS with different grades (b) and lymph node statuses (c) of patients with breast cancer in the indicated groups with different hRNase 1 levels. LN, lymph node. d Top, plots of IHC scores of hRNase 1 level in breast tumor tissues (T; n = 31) vs normal tissues (N; n = 12) (Pantomics Inc., #BRC961). Bottom, representative images of IHC staining of hRNase 1 expression in normal and breast tumor tissues. Bar, 25 µm. *p = 0.0188. e Box plots of IHC scores of hRNase 1 level in breast tumor tissues subdivided into four molecular subtypes. Case numbers are shown in the parentheses. f ELISA of hRNase 1 levels in serum samples of breast tumor patients (T; n = 50) compared with noncancerous individuals (N; n = 24). *p = 0.0382. g, ELISA of hRNase 1 levels in breast tumor serum samples subdivided into three molecular subtypes. Case numbers are shown in the parentheses. h Box plots of ELISA of hRNase 1 expression in the conditioned medium (CM) of eight breast cancer cells and two normal cells. KPL4 cell line as an outlier. i Western blotting (WB) of hRNase 1 expression level secreted in breast cancer cells; the experiment was repeated a second time with similar results. *p = 0.0415. Survival data were analyzed using Kaplan-Meier Plotter (Probe: 201785_at) and p values were calculated by Log-rank test (a–c). Error bars represent mean ± SD (f, g). *p < 0.05, ns, not significant, two-tailed unpaired t test (d, f, h), ANOVA analysis (e, g). Box plots indicate minima (lower end of whisker), maxima (upper end of whisker), median (center), 25th percentile (bottom of box), and 75th percentile (top of box) (d, e, h) as well as outlier (single point) (h). Source data are provided as a Source Data file.

