
Figure 4.
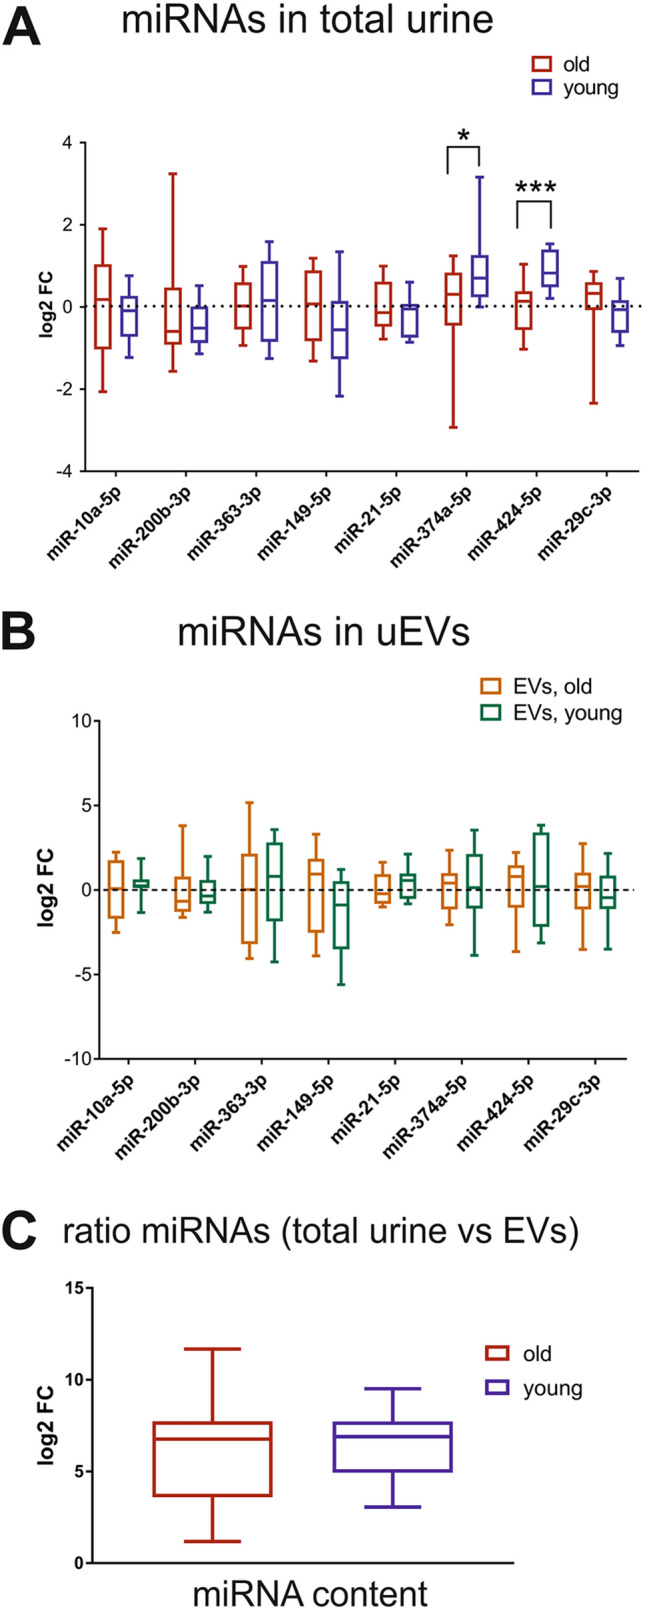
Profiling of abundant miRNA in the total urine and uEVs of healthy age-matched groups. RNA samples were derived directly from 37 ml of total cell-free urine or from uEVs, isolated by UC-SEC from 37 ml of the same urine sample, and miRNAs were profiled using RT-qPCR. (A) RT-qPCR results for 8 abundant miRNAs detected in the total urine of “young” and “old” healthy subjects in the morning and afternoon collection (n = 12 per group). Boxplot of log2 fold change relative to the average normalized Ct values in the “old” group. Statistically significant differences * p < 0.05, *** p < 0.001, multiple t-tests). (B) RT-qPCR results for 8 abundant miRNAs detected in the uEVs of “young” and “old” healthy subjects in the morning and afternoon urine (n = 12 per group). Boxplot of log2 fold change relative to “old” group. No significant differences were observed. (C) Log2 fold change between the total miRNA content, proportional to the average Ct values in all samples, and the exosomal miRNA content in the “old” and “young” subjects. No significant differences were observed.