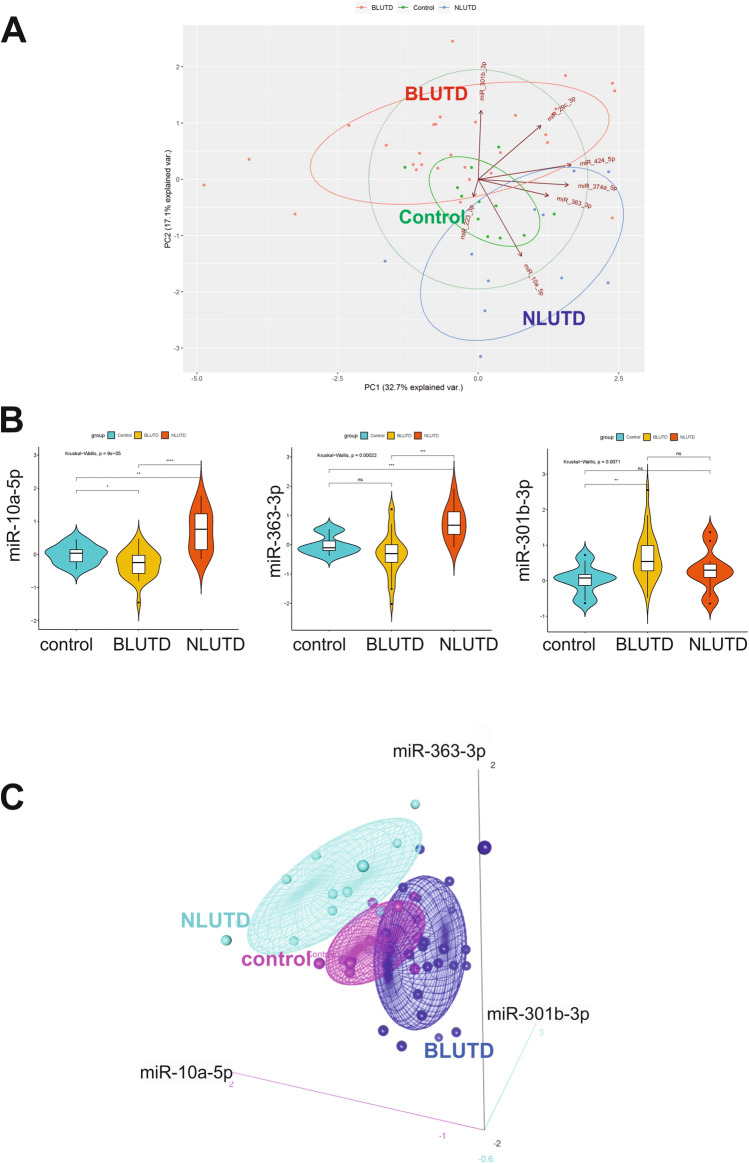
Figure 6.
Identification of a three miRNA urinary biomarker signature miR-10a-5p, miR-363-3p and miR-301b-3p for obstruction-induced LUTD. (A) Principal component analysis of miRNA expression was done based on profiles of 7 miRNAs determined by RT-qPCR for each group (n = 12 controls, n = 30 BLUTD and n = 11 NLUTD). The position of patients from each group on the plot indicates the similarity of miRNA expression pattern. Controls are shown in green, NLUTD in blue, BLUTD in red. PCA confirms that NLUTD samples are well separated from BLUTD based on their miRNA profiles. In this figure, the loadings are represented by arrows. Axis PC2 has a strong negative loading for mir-10a-5p, and strong positive loadings for mir-301b-3b. Axis PC1 shows a strong positive loading for mir-363-3p. (B) Regulation of the 3 significantly changed miRNAs in urinary samples of controls and patients with BLUTD and NLUTD. RT-qPCR results in patients’ groups are shown in a violin plot as log2 fold changes compared to controls. The graph is representing minimum, first quartile, median, third quartile, and maximum. *p < 0.05 **p < 0.001 and ***p < 0.0001 (Kruskal–Wallis test). (C) Three-dimensional scatterplots and point identification for 3 miRNA urinary biomarkers for bladder outlet obstruction. Log2 fold change values of miRNAs, miR-10a-5p, miR-301b-3p and miR-363-3p suggested by RT-qPCR validation of NanoString miRNA profiling of urinary miRNAs of patients with obstructive or neurogenic LUTD and controls are plotted. BLUTD values are shown in dark blue, NLUTD values in light blue and control values in pink. The three-miRNA signatures are sufficient to discriminate BLUTD, NLUTD and control groups from each other.

