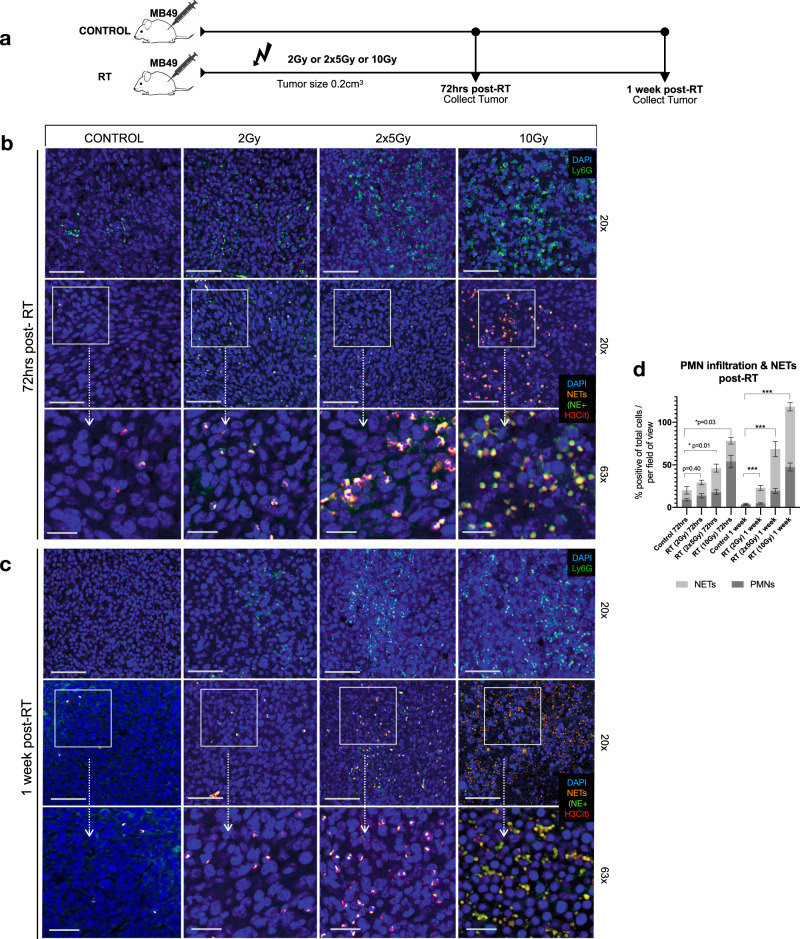
Fig. 1. Radiation induces NET formation in murine MB49 tumors.
a Schematic representation of time point experiment where tumors were irradiated with: 2 Gy, two fractions of 5 Gy (2 × 5 Gy) or 10 Gy. Tumors were collected 72 h and 1-week post-radiation (post-RT) for immunofluorescence analyses. b Representative confocal images of non-irradiated controls or irradiated tumors 72 h post-RT or c 1 week-post RT stained for PMNs (Ly6G-green, 20×, 63×) and NETs, representative from three independent experiments (H3Cit-red and NE-green, 20×, 63×), nuclei (blue). Scale bars are 50 μm for 20× images and 20 μm for 63× images. d Quantification of PMNs and NETs in confocal images using QuPath V6, expressed as percentage of positive cells per total cells per field of view. Data are expressed as mean ± SEM (n = 10 mice per group, n = 3). Unpaired two-tailed students t-test was used to assess statistical significance between groups (***p < 0.001 for NETs).

