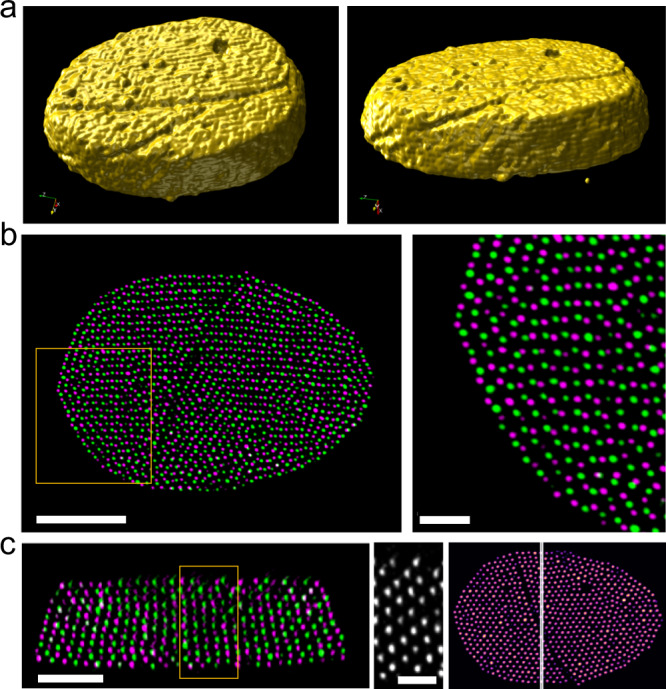
Fig. 3. Electron tomography and reconstruction of a single bcc crystal composed of (5.3k) Au-PS0. 60 NPs on the substrate.

PP/PE was added at a 3D visualization of the crystal surface (see “Methods”) clearly illustrating its overall shape and the defective top layers. b Two base plane layers plotted in green and purple, demonstrating a distorted hexagonal lattice in each plane. The registration between the layers is predominantly bridge sites, as seen in the enlarged view on the right. Scale bars are 100 and 25 nm. c Two consecutive planes within a vertical slice plotted in green and purple. PGNPs in one plane sit at the center of the PGNP squares in the other plane. The square lattice of one of the bcc (001) planes is shown in the enlarged view in the middle. The image on the right shows where the cut lies in the top view. Scale bars are 50 and 25 nm.
