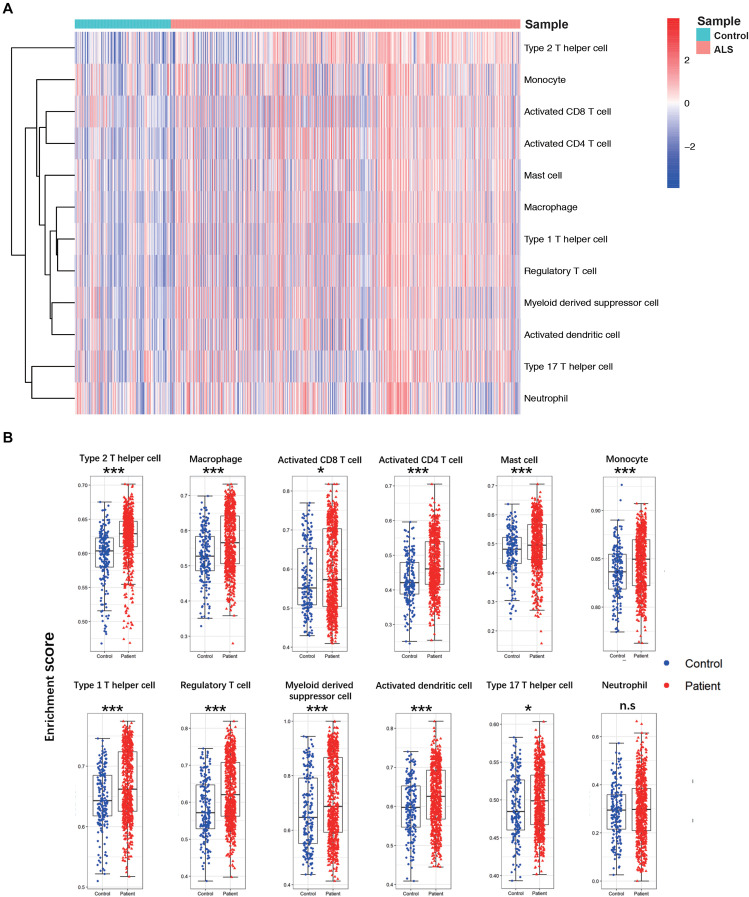
FIGURE 2.
The landscape of immune cell infiltration between ALS patients and non-neurological control subjects. (A) A heatmap of 12 immune cell infiltration based on single-sample gene set enrichment analysis. (B) Boxplot of comparisons of 12 immune-cell enrichment scores. The enrichment score of macrophages, Tregs, Th1, Th2, Th17, activated CD4 + T cells, activated CD8 + T cells, monocytes, activated dendritic cells, and mast cells myeloid-derived suppressor cells were higher in ALS patients than non-neurological control. *p < 0.05, **p < 0.01, ***p < 0.001.

