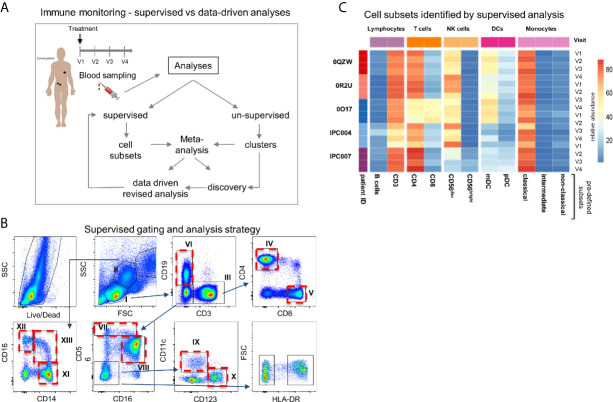
Figure 1.
Study design and cross-comparison between supervised and un-supervised data analysis. (A) Study design. Longitudinal blood samples were taken from patients initiating treatment. Peripheral blood mononuclear cells were labelled with an antibody panel and FACS data were processed in parallel with a supervised and an un-supervised data analysis. The cross-comparison of data lead to data-driven revised gating strategy and discovery. (B) Representative example of the supervised gating and analysis strategy of flow cytometry data. Arrows describe the hierarchical sequences of analysis (i.e. gating strategy). Identified cell subsets: lymphocytes (I), T cells (III) (CD3+ CD19-), CD4+ (IV) and CD8+ (V) T cells, B cells (VI) (CD19+CD3-), cytokine secreting NKbright (VII) (CD56hiCD16+/-) and cytotoxic NKdim (VIII) (CD56dimCD16+) NK cells, mDCs (IX) (CD123-CD11c+) and pDCs (X) (CD123+CD11c-); monocytes (II): classical (XI) (CD14+CD16-), intermediate (XIII) (CD14+/-CD16+/-) and non-classical monocytes (XII) (CD14-CD16+). Ten cell subsets are identified and highlighted with a red dotted frame. (C) Heatmap representation of the frequencies of the 10 different predefined cell subsets per patient and time point after supervised data analysis.

