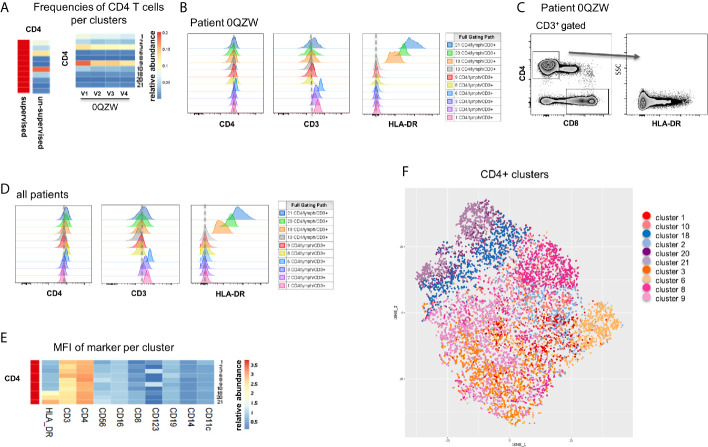
Figure 3.
Analysis of CD4+ T cell subsets identified by MegaClust. (A) Comparison of the different CD4+ cell clusters identified by MegaClust. Left panel shows one population of CD4+ T cells obtained by supervised analysis, whereas the unsupervised analysis identified 10 clusters within the CD4 T cell population. Four timepoints (visits, V1-V4) are shown for representative patient 0QZW. (B) Expression of CD4, CD3 and HLA-DR on the 10 CD4 T cell clusters on V1 from one representative patient 0QZW. (C) Expression of HLA-DR on CD4 T cells from patient 0QZW from the supervised dataset. (D) Cumulative analysis on all patients and timepoints (n=20) of the expression of CD4, CD3 and HLA-DR on the 10 CD4+ cell clusters. (E) Cumulative analysis on all patients and timepoints (n=20) of the expression level (mean fluorescence intensity, MFI) of different markers on all CD4 T cell clusters. (F) tSNE of all CD4+ T cell clusters identified with Megaclust.

