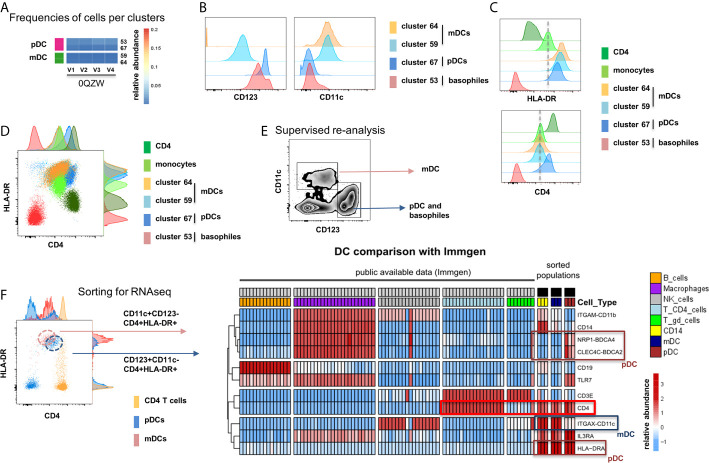
Figure 5.
Identification of multiple mDC and pDC subsets by MegaClust. (A) Comparison of the different clusters identified by MegaClust as mDCs and pDCs (example for one patient for four time points). (B) Expression level of CD123 and CD11c of the two mDC clusters and the two pDC clusters identified by MegaClust. (C) Expression levels of HLA-DR and CD4 for the two pDC clusters and the two mDC clusters identified by MegaClust. Cluster 53 could be assigned as basophils due to the lack of expression of CD4 and HLA-DR (25). The expression of CD4 is shown for CD4 T cells and CD14+ monocyte clusters for comparison. (D) Overlay of CD4 and HLA-DR of MegaClust identified clusters for mDC, pDC, basophils, CD4 and monocytes. (E) mDCs and pDCs were discriminated according to CD11c and CD123 expression in the supervised flow cytometry re-analysis according to the new gating strategy described in Supplementary Figure 5 (one representative patient 0QZW). (F) Representative illustration of HLA-DR and CD4 co-expression on mDCs and pDCs prior to FACS sorting CD11c+CD123-CD4+HLA-DR+ mDCs and CD123+CD11c-CD4+HLA-DR+ were FACS sorted (dotted lines). (G) Gene expression profiles of flow cytometry sorted CD11c+CD123-CD4+HLA-DR+ mDCs, CD123+CD11c-CD4+HLA-DR+CD4+HLA-DR+ pDC and CD14+CD16- monocytes from 3 healthy donors are shown in comparison to the RNA expression profile of public available RNAseq datasets (Immgen) indicating the gene expression profile of B cells, macrophages, CD4 T cells, γδ T cells and NK cells.

