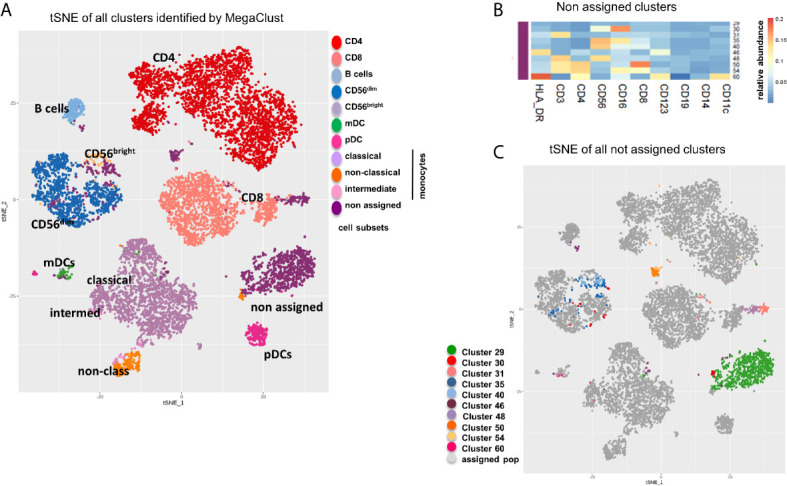
Figure 6.

tSNE of all clusters identified by MegaClust. (A) tSNE plot showing all clusters and populations identified by MegaClust. The different cell populations are color-coded and listed on the right. One group contains clusters of cells that where not assigned. (B) Cumulative analysis on all patients and timepoints (n=20) of the expression level (mean fluorescence intensity, MFI) of different markers on the 10 unassigned clusters. (C) tSNE plot showing all clusters and populations identified by MegaClust, with the 10 clusters identified by MegaClust that could not be assigned to known reference populations highlighted with distinct colours.
