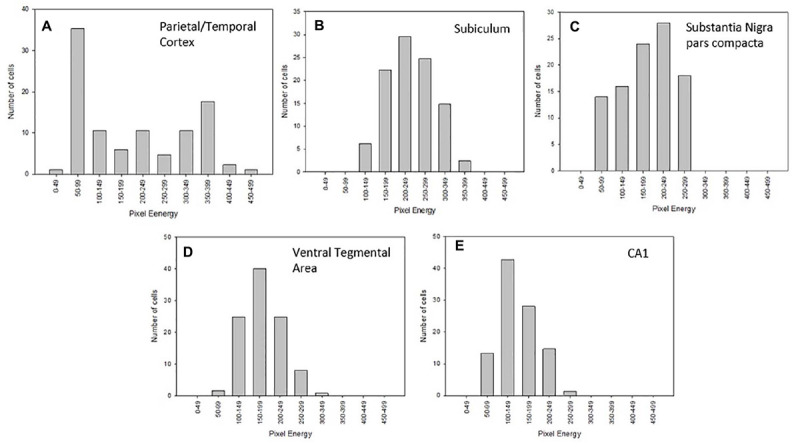
FIGURE 6.

Histogram analysis of Nurr1 protein expression in the parietal/temporal cortex (A), subiculum (B), substantia nigra-pars compacta (SNpc-C), ventral tegmental area (VTA-D), and CA1 of the hippocampus (E) using data associated with 10 nM Nurr1 primary antibody concentration on fresh frozen section. The Nurr1 labeled nuclei were analyzed using the highest 50 cells with increasing intensity. Within the parietal/temporal cortex, a wide distribution of intensities was observed, with peaks at low and high values. The analysis of the other areas revealed a more homogeneous distribution. Analysis is based on measurements from three mice.
