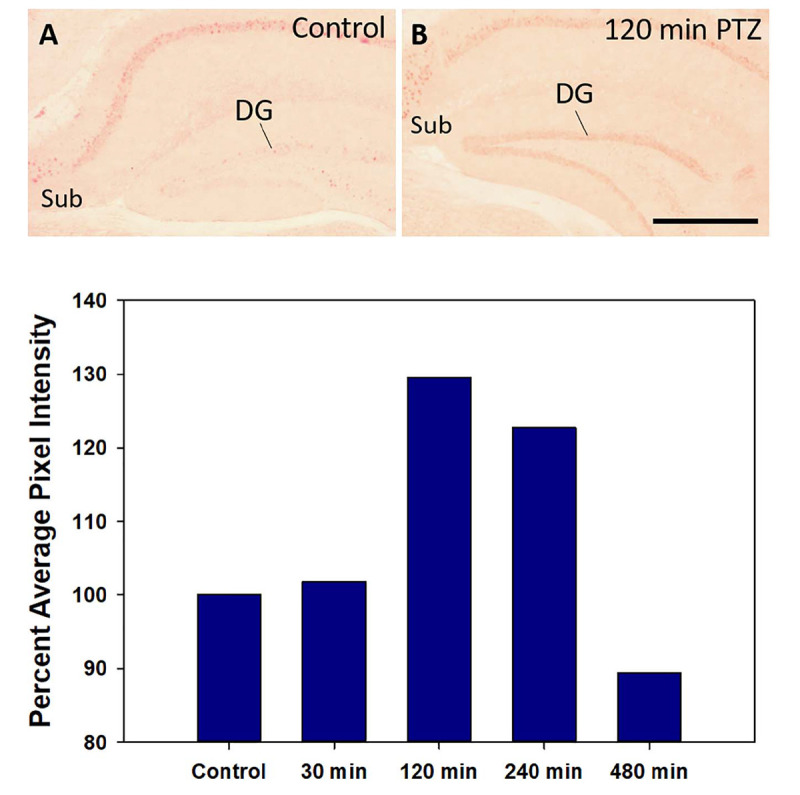
FIGURE 8.

Nurr1 protein expression in the hippocampus in a control mouse (A) and 120 min after a PTZ seizure (B). Relative pixel energy for Nurr1 immunohistochemistry in the dentate gyrus (DG) of the control (100%) was compare to pixel energy in the DG 30 min, 120 min, 240 min, and 480 min after a single PTZ seizure. Quantification of Nurr1 protein expression based on relative pixel energy across time after a single PTZ demonstrates at peak around 120 min that returns to near basal level by 480 min. Scale bar = 200 μm.
